Module f14

Step 5. Data Available Before Landing

Satellite Images, taken 2 hours before the arrival time at Toronto

For the year of this flight, satellite images were not as good as today.  Also, as you were on a very long flight across the Atlantic Ocean, you would not have seen these satallite images before starting your flight.  However, weather briefers and air traffic controllers on the ground would have used these satellite photos to help them interpret the weather.

Water-vapour image

GOES12-water vapor

Interpretation:  The blue spot (near the center of this image) at the west end of Lake Ontario indicates a deep layer of moisture (clouds & rain), that could be associated with thunderstorms.  Toronto is at the west end of Lake Ontario.

Visible image

GOES12-visible
Interpretation: Within the area outlined in pink is a diagonal line of clouds (that appear white) running from the northwest to the southeast, over the west end of Lake Ontario.

Infrared (IR) image

GOES12-ir

Interpretation: The dark blue spot over western Lake Ontario indicates high (cold) cloud tops, typical of thunderstorm anvil clouds.

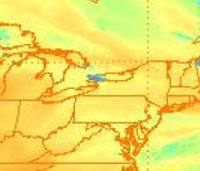
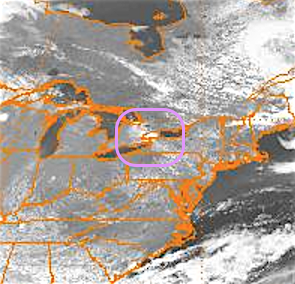
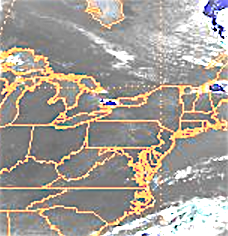
Image credit for all the satellite images: Images retrieved in May 2017 from the US National Climatic Data Cente at https://www.ncdc.noaa.gov/gibbs/html.   Knapp, K. R., 2008: Scientific data stewardship of International Satellite Cloud Climatology Project B1 global geostationary observations. Journal of Applied Remote Sensing, 2, 023548,  doi:10.1117/1.3043461


Radar Images

One hour before arrival.   The white "X" is at the approximate location of Toronto airport.
BUF radar hour before
Interpretation:

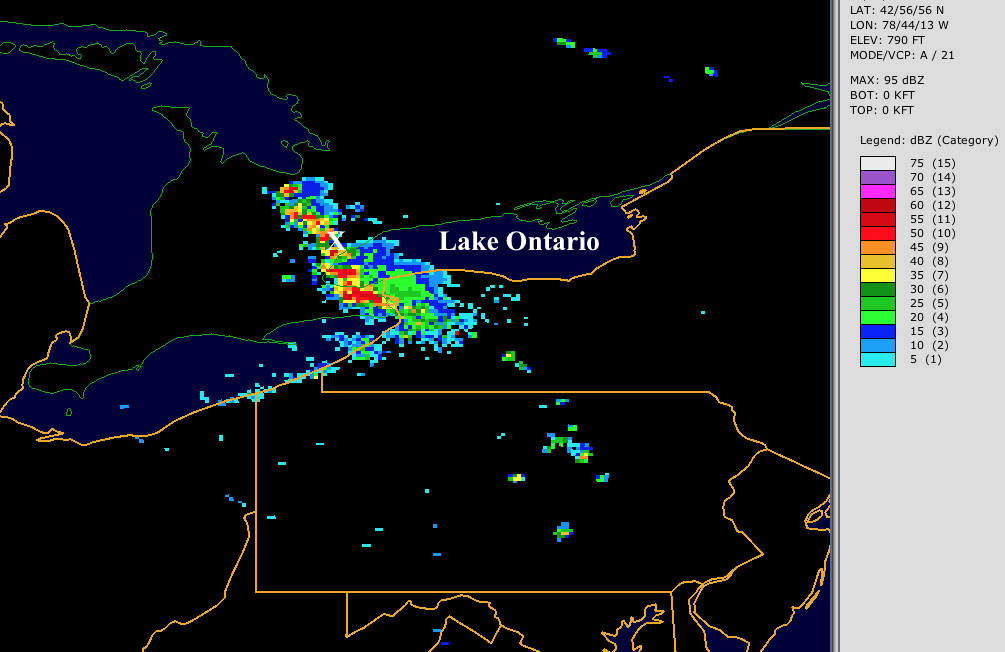
Radar image courtesy of US National Centers for Environmental Information (NCEI):  https://www.ncdc.noaa.gov/


UBC ATSC 113 Weather for Sailing, Flying & Snow Sports
Copyright © 2017 by Roland Stull
Last modification: May 2017
.