ATSC 113 Weather for Sailing, Flying & Snow Sports
Symbols on Weather Maps
Learning Goal 1f. Recognize and interpret certain weather and obscuration glyphs on weather charts.
Weather maps show locations of weather stations worldwide. Each weather station observes
many
weather variables (wind, temperature, clouds, weather, precipitation, etc).
The
issue: how to display so much info at so many locations on the
same
map? The solution: meteorologists devised symbols or glyphs
as a
short-hand notation for many of these weather variables.
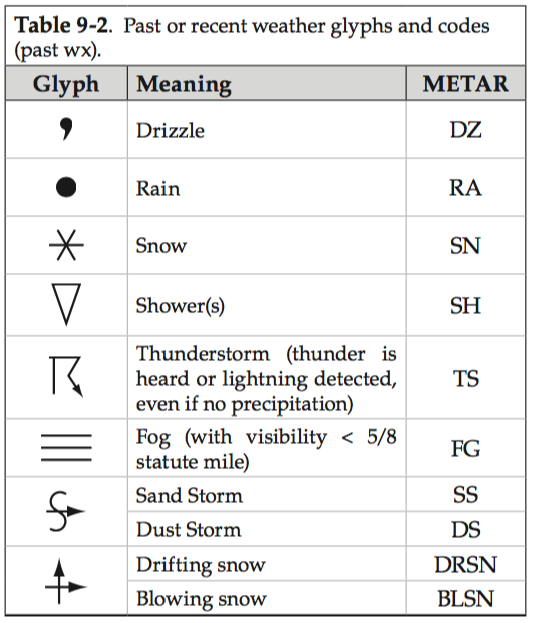
In the tables below, the glyph is the symbol that is used on weather maps. Also listed for completeness is the text abbreviation for the same phenomenon, which is used in text-based Meteorological Aviation Reports (METARs). For this course, focus only on the glyphs.
For this learning goal we consider only a small sample of the glyphs used in meteorology. There are many more that are not shown here, and for which you are NOT responsible to know for this course. Please focus on only the key glyphs shown here.Weather and Storm Glyphs
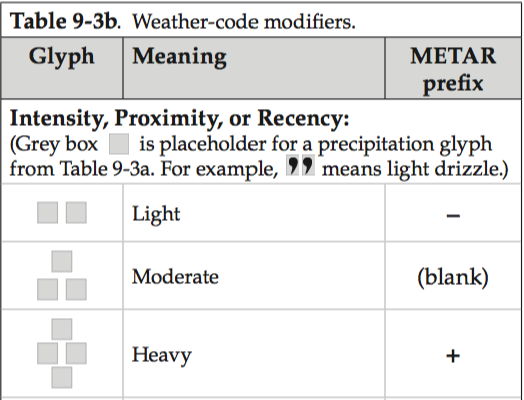
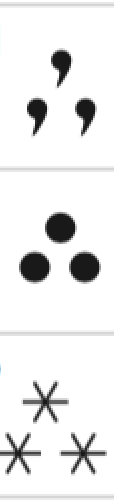
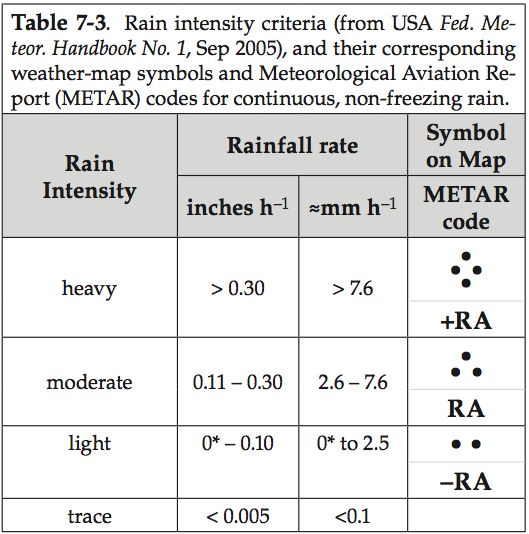
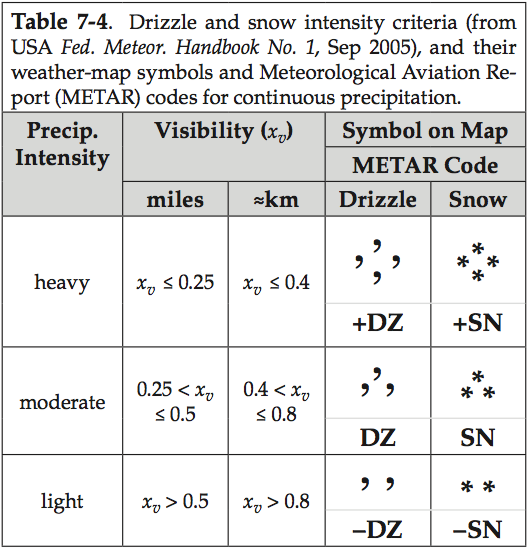
The intensity of the precipitation is indicated by the number and arrangement of those glyphs, as described in Table 9-3b. Also, a descriptor for the precipitation can be included. Here is just a subset of intensity and descriptor glyphs:
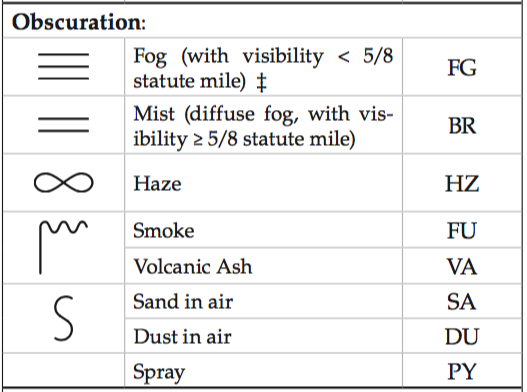
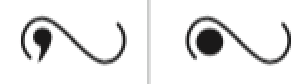
Obscuration Glyphs
Examples of Combinations of Glyphs
The glyphs described above can be combined in logical ways. Here are some examples:
| Glyphs |
Meanings |
|---|---|
 |
. Moderate-intensity drizzle . . Moderate-intensity rain . . Moderate-intensity snow |
 |
. Rain shower | snow shower |
  |
Thunderstorm with rain | Thunderstorm with snow |
 |
Freezing drizzle | Freezing rain |
Keywords: drizzle, rain, snow, heavy, light,
moderate, shower, thunderstorm, freezing, fog, haze, mist, smoke, sand, blowing
Extra info for Experts; Not Needed for this Course.
Explanation of "light", "moderate", and "heavy" precipitation
For rain, the intensity is given by how fast a bucket or rain gauge fills with rainwater, i.e. the increase in water depth per hour (e.g. mm/h). Table 7-3 gives the details.
For drizzle and snow, the intensity is given by how poor the visibility is. Visibility is how far you can see through the atmosphere, and is discussed in Learning Goal 9e. It is measured as a distance (e.g. km). Table 7-4 gives the details.
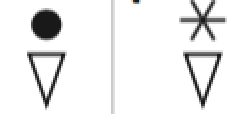
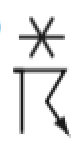
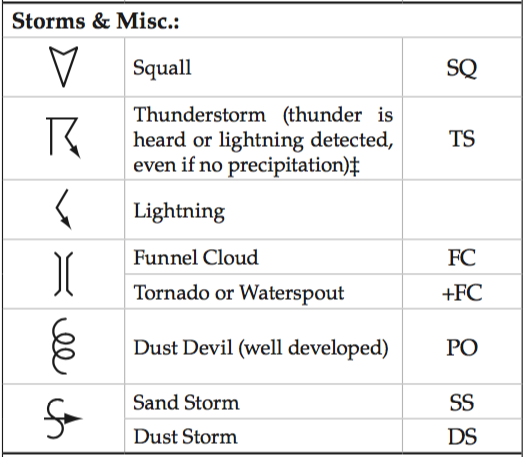
Storm Glyphs
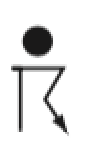
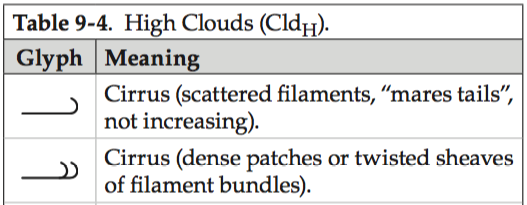
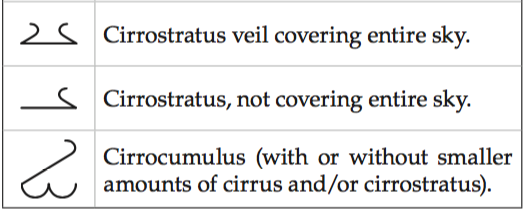
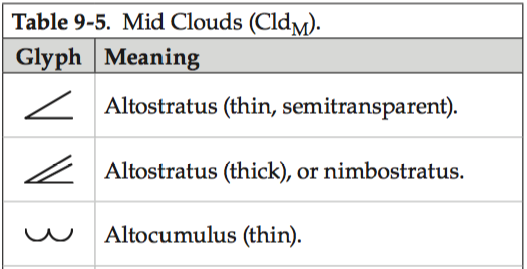
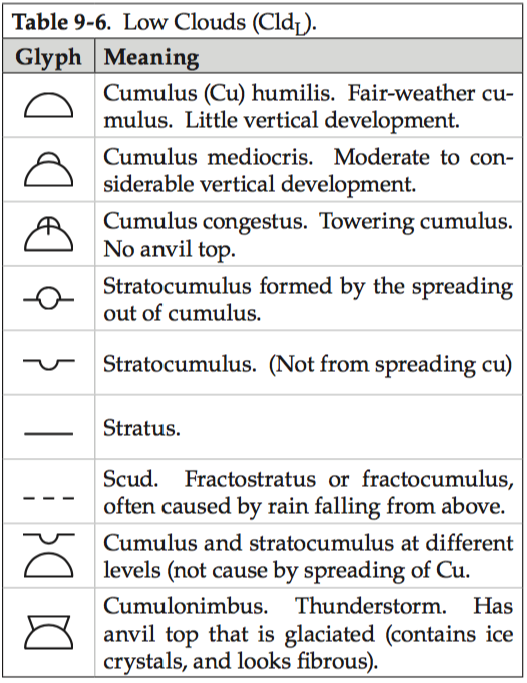
Cloud Glyphs
There are many cloud glyphs, so we will focus on the main ones here. Refer back to Learning Goal 9a to see photos of these clouds.
Other useful links for experts:
.
.
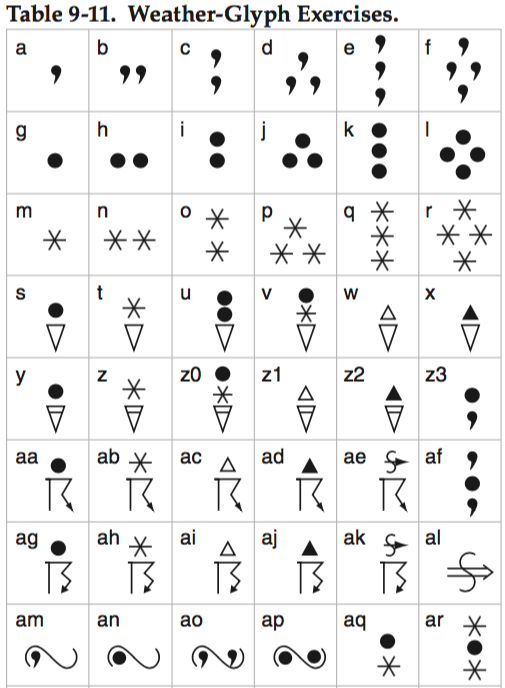
Practice Exercises for Experts (not needed for this Course)
Sample Answers:
Exercise (c) shows the symbol for intermittent moderate drizzle.
Exercise (s) shows the symbol for a light rain shower.
Exercise (ab) shows the symbol thunderstorm with snow.
While the above tables showed the general principles used to organize the weather-map symbols, here is a link that shows each specific symbol with an explanation of what it means.
(Courtesy of the US National Center for Atmospheric Research. From http://weather.rap.ucar.edu/info/wxSymbols_anno1.pdf , downloaded on 24 May 2017.)
NCAR: Comparison of weather-map symbols with METAR codes.
Stull, 2017: Practical Meteorology (PrMet): Chapter 9. Weather Reports & Map Analysis
World Meteorological Organization (WMO): WMO International Cloud Atlas Manual on the Observation of Clouds and Other Meteors
American Meteorological Society (AMS): Glossary of Meteorology
Stull, 2017: Practical Meteorology (PrMet): Chapter 6. Clouds
Keywords: Meteorological Aviation Report (METAR)
Image credits. All figures by Roland Stull, except for two from NCAR, as credited at the links to those two figures.