ATSC 113 Weather for Sailing, Flying & Snow Sports
Static Stability and Atmospheric Soundings
Learning Goal 3b. Determine the static stability given temperature
soundings, and describe its effects on air motions and on aviation
Atmospheric stability refers to whether the air will become or stay turbulent (unstable static stability) or will become or stay non-turbulent (stable static stability). Another word for non-turbulent is "laminar", which implies smooth flow.
Turbulence ranges from small eddies caused by air flow around a tree or obstacle, through medium-size eddies (about 2 km in diameter) associated with warm rising air in "thermals", to large-scale instability associated with thunderstorms (about 10 to 15 km in diameter). Turbulence on all scales affects aircraft, sailboats, and snow-ski races.
Static Stability
The simplest type of stability is called static stability. It is simple because it depends only on the temperature layering in the atmosphere, not on the wind. This stability is related to the fact that cooler air is denser (heavier) than warmer, less dense air. You can think of the atmosphere as a layer cake, where each layer has a different temperature.
If atmospheric structure is such that the cool (heavy) layer of air is under the warmer (lighter) layer, then that part of the atmosphere is said to be statically stable. If there is no wind shear, then a statically stable region is non-turbulent, because the air is "happy" where it is. Namely, the colder air doesn't need to sink because it is already at the bottom of the layer cake.
But if the warm (lighter, more buoyant) air is under the cooler denser air, then the atmospheric structure is "unhappy". The cooler air starts to sink and the warmer air starts to rise (as buoyant thermals) as it tries to get "happier". In this situation, the atmospheric structure is statically unstable. The atmosphere "turns over", where the cooler air and warmer air change places is a complex turbulent dance of eddies. It is like when you cook soup or sauce in a pot on the stove. When the bottom of the fluid becomes warmer than the top, the fluid in your pot is statically unstable and becomes turbulent as the warm soup or sauce tries to rise through the cooler layer.
There is an added complication in the atmosphere that does not affect liquids such as your soup or sauce. That complication is that when air rises in the atmosphere, it moves into regions of lower pressure, which allows the air to expand and get cooler. Similarly, when air sinks in the atmosphere, it is compressed in the higher pressure and becomes warmer. This temperature change for vertically moving blobs of air (air parcels) is called the adiabatic lapse rate, and has a value of 9.8°C/km. Namely, rising air cools about 10°C for each 1 kilometer that it rises, and sinking air warms at the same rate. This adiabatic temperature change is normal and happens all the time. But we need to add this effect to determine static stability.
Here is a tool that you can use to graphically find the
static-stability index, S, if you know the temperatures at the top and
bottom altitudes of a layer of air. (This graphical tool will be provided on the exams if needed to answer any of the exam questions.)
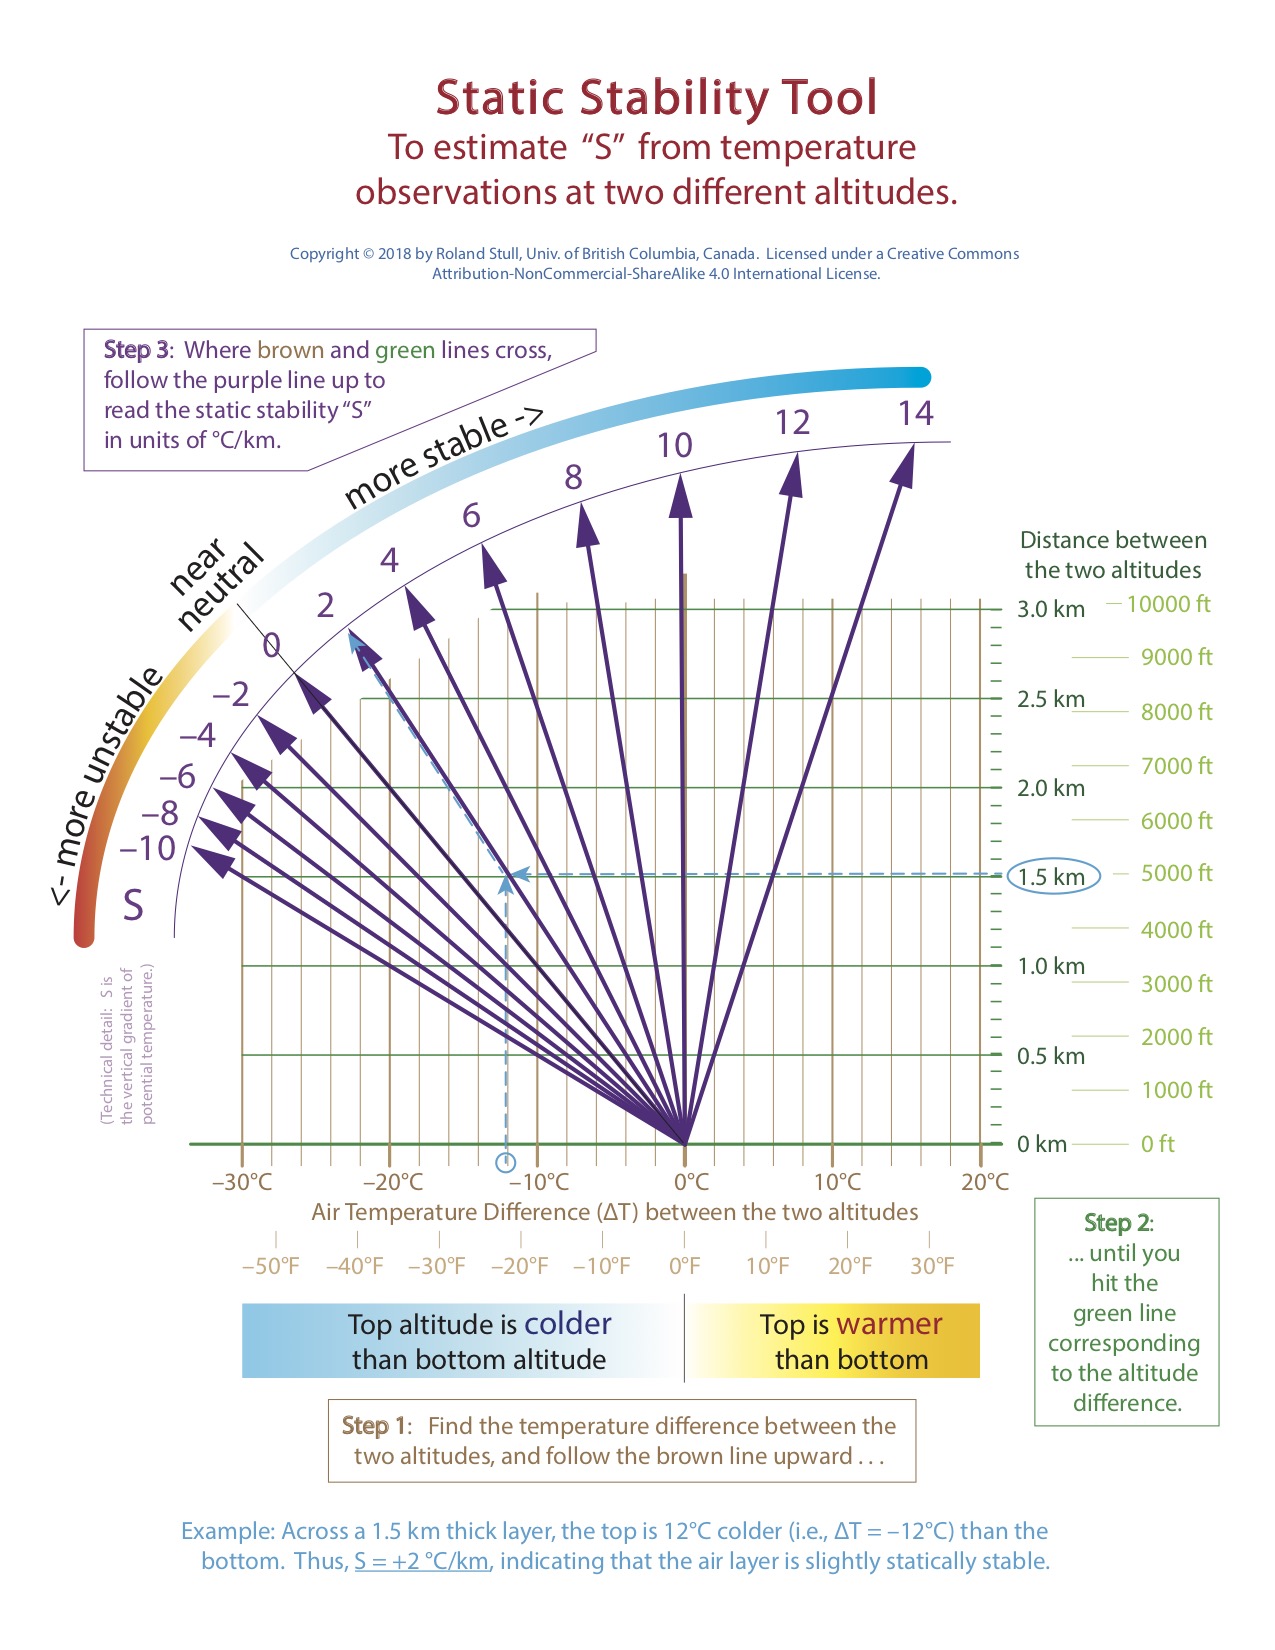
Here is how you interpret "S":
- If S is positive, then the air layer is statically stable,
and the air becomes
non-turbulent (if no wind shear exists)
- If S is zero, then the air is statically neutral (neither stable nor unstable)
- If S is negative, then the air is statically unstable, and the air becomes turbulent
One final trick: Unstable air always wins, if your computation gives different values of S for the same location.
Solved example
Solution:For the bottom layer (between the middle and bottom altitudes):---
---
Discussion: Since unstable always wins, in
means
that all three layers are unstable and turbulent. This is typical of
thermals rising on a sunny day over land. Perfect conditions for
sailplanes and birds to soar in the thermal updrafts, but causing a
bumpy ride for light airplanes. So keep the barf bags available for your passengers. |
Static stability affects aviation weather as follows:
In statically stable conditions:
- Typically forms near the ground at night under clear skies with calm-to-light winds, when the ground temperature decreases, and the ground cools the air that touches it.
- Air is usually nonturbulent (a smooth ride in an airplane) if there is no wind shear.
- But if this air is forced up over a mountain, then on the downwind side it sinks past its starting altitude (i.e., overshoots downward), and then starts to rise again and overshoots upward, and keeps oscillating as a mountain wave.
- Cold air near the ground can drain downhill and can pool in the valley floor, where frost or fog can form in the cold air.
- If there is wind shear in a statically stable region, then turbulence can form, along with breaking atmospheric waves called Kelvin Helmholtz waves (see Learning Goal 1b).
In statically neutral conditions:
- Typically forms in overcast conditions (day or night) when the wind is moderate or strong.
- Air can be nonturbulent, but the slightest wind shear can create dynamic instability and turbulence.
- Neutral air hitting a mountain creates obstacle wake turbulence downwind of the mountain.
In statically unstable conditions:
- Typically occurs in sunny days over land when the average winds
are relatively light.
- It can be caused when the sun heats the land and the land warms the bottom layer of air.
- Thermals of warm air rise with cooler descending air between the thermals.
- Cumulus clouds might form at the top of the thermals if the thermals are humid enough and the unstable air is deep enough.
- If the unstable air extends over most of the depth of the troposphere, then thunderstorms can form (with many flight hazards).
Thunderstorm Stability Indices
As thunderstorms are hazardous to flight, many additional stability indices are have been devised for thunderstorms. Two of those indices are described here, because they are used in Learning Goals 4a-h about thunderstorms. These indices don't tell us if a thunderstorm will form - - they tell us only how strong the storm might be if it forms.Convective Available Potential Energy (CAPE) is one index. It is a measure of the accumulated buoyant energy of a rising blob of warm humid air relative to the cooler surrounding environment that it is rising through. More violent storms are associated with larger values of CAPE. There are different ways to estimate CAPE - - the table below uses "most unstable" CAPE.
| CAPE (J/kg) |
Interpretation |
|---|---|
| 1750 |
Ordinary thunderstorm |
| 1850 |
Marginal supercell thunderstorm |
| 1950 |
Supercell thunderstorm, but no
tornado |
| 2150 |
Supercell thunderstorm with weak
(EF0 to EF1) tornado |
| 2850 |
Supercell thunderstorm with
strong (EF2 to EF5) tornado |
An older measure is called the K Index. It looks at temperature and dew-point (humidity) of the environment at just a few key altitudes, and is useful for indicating rain intensity in thunderstorms (see table below).
| K Index (°C) |
Interpretion |
|---|---|
| less than 20 |
Thunderstorm unlikely |
| 20 to 30 |
Chance of scattered thunderstorms |
| 30 to 40 |
Many thunderstorms likely, some
with heavy rain |
| greater than 40 |
Many thunderstorms with very
heavy rain |
We don't need to know how to calcualte CAPE and K indices, because they are automatically calculated from upper air soundings. However, the tables above guide us in interpreting the results.
Temperature Soundings (Upper air Soundings)
To determine the stability, we need weather conditions (temperature, wind, etc.) at many different heights. This is called a sounding.
While climbing or descending in your aircraft, if you record the outside air temperature at a bunch of different altitudes, then you have made a sounding. Modern commercial aircraft have automated systems (AMDAR - click on this link to download a tutorial movie) on board to make these measurements and relay them by radio or satellite to government weather centers.
Also, most countries have national weather services that launch weather ballons called rawinsondes. These small helium-filled latex balloons (first photo below) have a small sensor package (second photo below) and radio transmitter hanging from the bottom of the balloon.
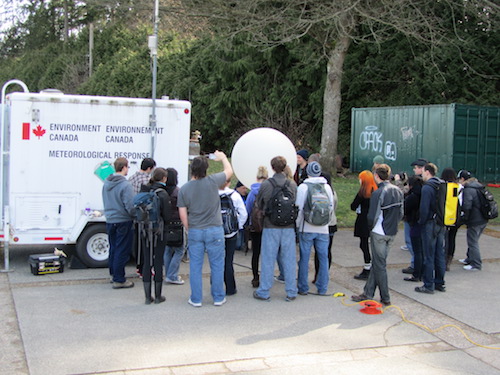
— Environment Canada rawinsonde balloon launch at UBC in 2011.
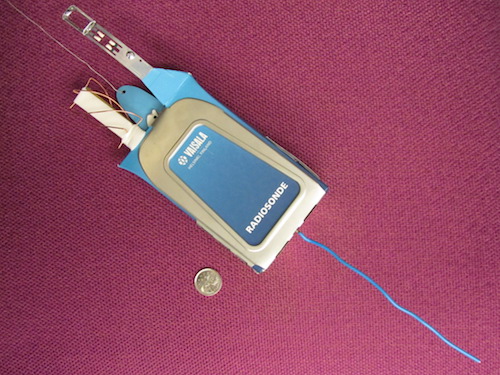
— Example of a sonde (i.e., the sensor package). The dime is shown for scale.
As the balloon rises, the sensor package measures temperature, humidity, and pressure. Also, modern sondes have GPS, so they can also measure altitude, and can infer the wind by recording the balloon location as it blows downwind. Eventually at high altitude, the balloon bursts and the sensor package gently falls by small parachute to earth. These are expendible and are launched twice each day (00 UTC and 12 UTC) from "upper air" sites around the world (see next figure).
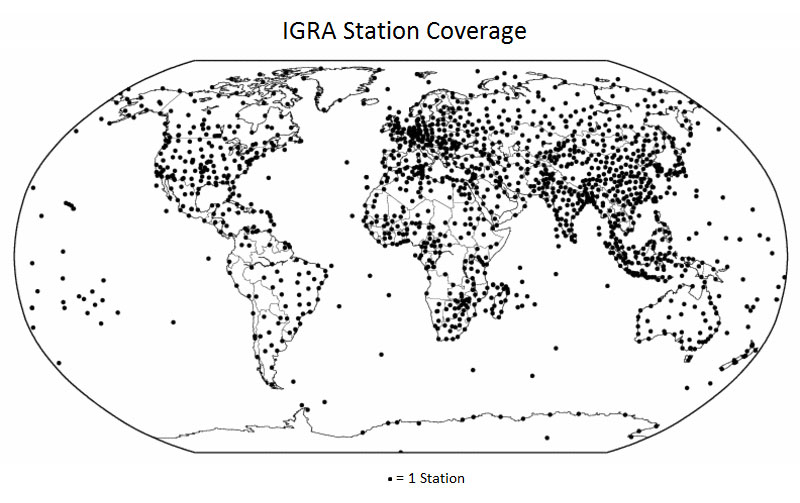
— Radiosonde (upper air) launch sites around the world. (Courtesy of NOAA).
There is no routine sounding site in Greater Vancouver. The closest one is Quillayute, WA (station identifier = UIL), southwest of UBC on the Olympic peninsula of Washington State. Next is Port Hardy, BC (station identifier = YZT), northwest of UBC near the northern tip of Vancouver Island. To the east of UBC is Kelowna, BC (station identifier = WLW).
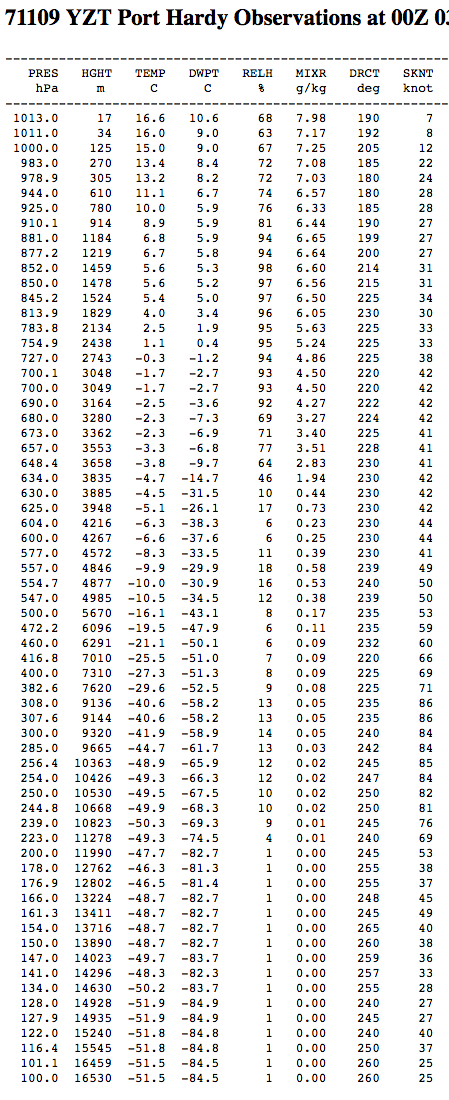
You can retrieve current soundings from a very nice Upper Air site at the University of Wyoming. For example, below is a sounding I retrieved for Port Hardy, where PRES = pressure, HGT = height or altitude, TEMP = temperature, DWPT = dew-point temperature (a measure of humidity), RELH = relative humidity, MIXR = mixing ratio (another measure of humidity), DRCT = wind direction, SKNT = wind speed. You can also get the spreadsheet of that data here.
Here are videos of balloon launches:
As part of the ATSC 303 Meteorological Methods (Weather Instruments) course in 2011, we launched one from the Thunderbird Stadium parking lot at UBC.
Key words: atmospheric stability, laminar, turbulence, static stability, air parcels, adiabatic lapse rate, sounding, rawinsondes, stable, neutral, unstable, CAPE, K index
| Xtra info for Experts The stability index "S" is actually the vertical gradient of potential temperature, defined by
|
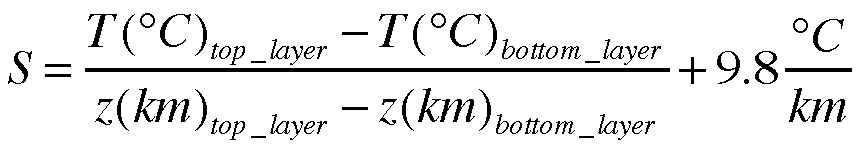
Image credits. All the photos were taken by Roland Stull, and the drawings were made by Roland Stull, and all are copyright by him and used with his permission.