ATSC 113 Weather for Sailing, Flying & Snow Sports
Weather Map Interpretation
Learning Goals 11c:
- Recognize weather map features including highs, lows, fronts, isobars, and use them to infer winds, clouds and bad weather.
- Utilize forecast maps and barometers to anticipate how future weather will affect your voyage.
Weather maps summarize weather info on a geographic frame of reference.
- Present weather - Maps that are created from current (or recent past) weather observations are called Analysis Maps.
- Future weather - Maps produced by Numerical Weather Prediction (NWP) computer codes for the future are Forecast Maps or progs (short for "prognosis").
Both maps can look similar to each other, so you need to find the Valid Time that is printed on each map to see if it is for the past, present, or future.
Forecasts further into the future are less and less accurate. For this reason, it is wise to get frequent updates to the weather analyses and forecasts to ensure that you have the "freshest" data.Reading weather maps
The following example is for a weather analysis over the North Pacific
Ocean. The first image below is the actual weather map, provided by the US NOAA Ocean Prediction Center (OPC). The
second image below is the same map for the same valid time, where I
annotated features on the map. (Sorry, I cut off the "valid time"
that was on the orignal map.)

Original map above. Source: NOAA Ocean Prediction Center. https://ocean.weather.gov/Pac_tab.shtml
Annotated map below.

Let's explore this map one step at a time. Focus on the the
first map above, but use the second map to help identify features.
-
High- and Low-pressure centers are indicated with H and L, respectively. On the first map above, the Lows are in red, and the Highs are in blue. Recall that Lows are associated with bad weather (clouds, wind, precipitation, fronts), and Highs with good weather (clear skies, light winds). The blue numbers with underlines indicate the central pressure of the low or high - - insert a decimal point in front of the last digit to get kPa.
Using the first map above, can you find 3 Lows on this map? Can you find 2 Highs on this map?
-
Fronts are the curved lines with triangles (for cold front), semi-circles (for warm front), both on the same side of the line for occluded fronts, and both on opposite sides of the line for stationary fronts. On this map, cold fronts are blue, warm fronts are red, occluded fronts are purple, and stationary fronts switch between red and blue colours. Fronts usually come out of a Low like (curved) spokes of a wheel.
We discussed fronts in detail in the flying and snow-sports portions of this course. In summary, fronts are a focus of bad weather, strong winds, wind-direction shifts, clouds, and precipitation.
• Cold fronts can have convective clouds (thunderstorms, squall lines, spotty heavy rain showers) along them.
• Warm fronts can have broad areas of stratiform clouds with widespread areas of drizzle and light rain ahead of them.
• Occluded fronts have bad weather similar to both cold and warm fronts.
Using the first map above, can you find 2 or more cold fronts? Can you find 2 or more warm fronts? Can you find 1 occluded front? Can you find 1 stationary front?
-
Isobars connect lines of equal pressure. They are the curved lines shown in brown on this map. The unit of pressure is kiloPascals (kPa). The labels on isobars are abbreviated. For example:
- 24 means 102.4 kPa
- 16 means 101.6 kPa,
- 04 means 100.4 kPa
- 92 means 99.2 kPa
-
68 means 96.8 kPa
Namely, insert a decimal point before the last number, and put "10" or "9" in front of the number (use whichever one gives a pressure closest to 100 kPa).
Why do we care about isobars? Because the wind blows almost parallel to the isobars. The closer neighboring isobars are to each other, the faster the wind speed. Wind speed and direction are very important for sailing.
Using the first map above, can you find an isobar representing 100.8 kPa? Can you find the 101.2 kPa isobar? How about the 98.0 kPa isobar?
-
Winds are not shown on this map (except at a few ships and islands). Instead, I inferred the winds from the isobars as discussed in item (3) above), and I drew these wind directions as black arrows on the second map above. In the Northern Hemisphere, winds go in a direction such that low pressure is to the wind's left, and the winds are nearly parallel to the isobars, but the winds cross the isobars at a small angle (due to frictional drag against the sea surface). You can see in the second map above that my black arrows show directions that are consistent with the isobar directions. Also, I added "fast winds" where isobars are closely packed together, and "slow winds" where the isobars are spaced out.
Can you anticipate the wind direction in the upper right corner of the first map? How about in the bottom right corner of the first map?
-
Warnings for marine weather hazards are abbreviated and enclosed in a small blue box. Warnings were discussed in the previous Learning Goal.
In the first map above, can you find the 2 locations with GALE warnings? How about the location with Heavy Freezing Spray?
-
The first map also shows some other features, including developing fronts and Lows, and dying fronts. Also, the forecast movement of Low centers are shown with red arrows. These are highlighted in the second map above. These features are important for sailors so that you don't accidentally plan your voyage into a location toward which bad storms are moving, or where new storms are developing.
A different weather map example for a different date is shown in the
image below, also provided by NOAA OPC. You can see a Low
pressure system (L) in the Gulf of Alaska (top center part of the map),
a Hgh pressure system (H) west of the USA approaching
the coast of BC and Washington. A Low (L) is just southeast of the
Vancouver area.
Can you find a cold
front? A warm front? A stationary front? Also, what
is the Valid Time for this weather analysis? Given the isobars,
can you anticipate with wind direction and relative speed (fast or
slow)? Can you see where the Lows and Highs are predicted to move?
Source: NOAA OPC.
Here is yet another example, this one is an Analysis provided by Environment and Climate Change Canada (ECCC). https://www.weather.gc.ca/analysis/index_e.html
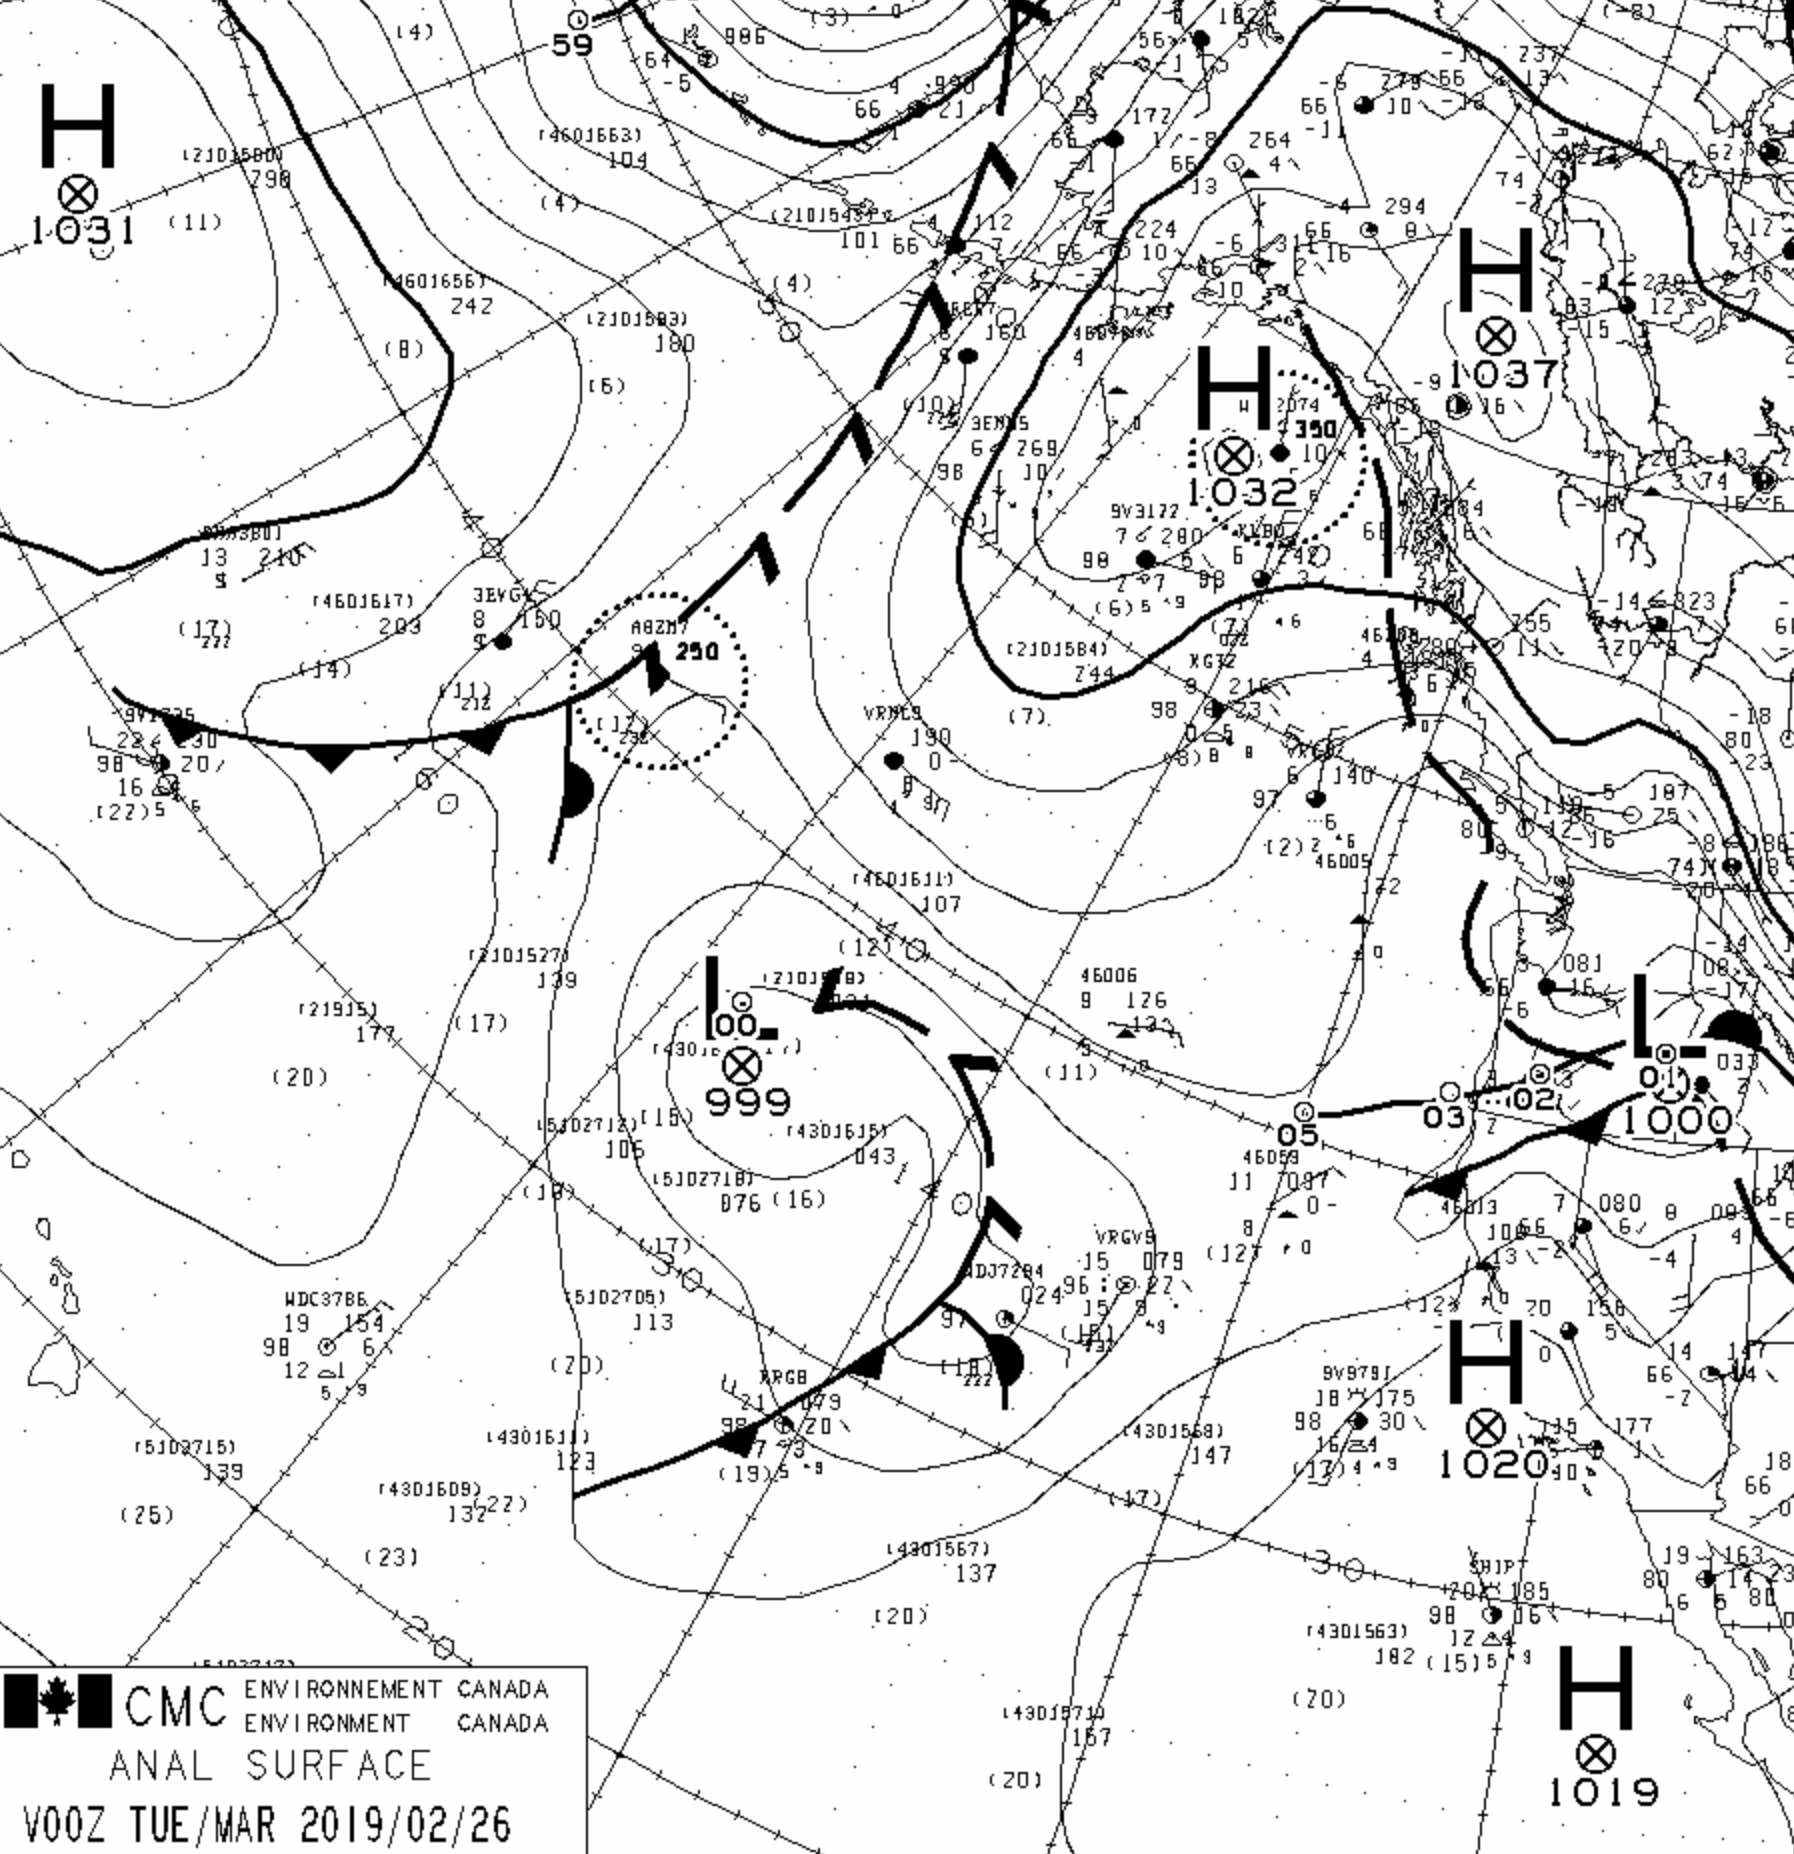
In addition to the symbols we already dicussed, a new frontal symbol
is shown here as a series of "check marks". This is a Trough of Warm Air Aloft (TROWAL),
and is the Canadian symbol for a type of occluded front. Namely,
it has bad weather similar to both warm and cold fronts.
Here’s a legend on how to interpret many of these and other weather symbols (recall that you learned some of these in Flying Learning Goal 1f):
Source: State of New Jersey, Department of Environmental Protection, SEEDS – The State Environmental Education Directory, http://www.state.nj.us/dep/seeds/wssym.htm
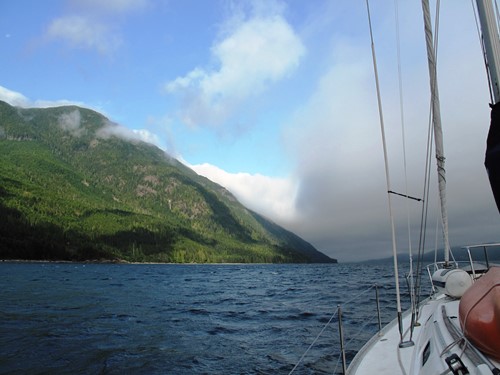
You can anticipate changes in weather by monitoring the movements of
fronts and areas of high and low pressure on weather maps and satellite
images. If you can see a front approaching your location, you can
expect to see a change in weather once the front reaches you (such as
in the image below, where the sailboat has crossed a front into a new
weather system). Your route may need to be changed or your trip delayed
as different weather systems approach you (for example, see Volvo race
video in non-required videos at the bottom of the page).
Barometers and Air Pressure
Air pressure is the weight of the air over the ground and its unit
is the kiloPascal
(kPa). Historically, older units have been used for pressure, and
are sometimes still used on marine weather charts: millibar (mb) and
hectoPascals (hPa). It is easy to convert between these
units: 10 mb = 10 hPa = 1 kPa.
Average air pressure is around 101.3 kPa. A high pressure system would give you a reading closer to 103.0 kPa and a low pressure system might give you a reading around 100.0 kPa. Look back at our weather maps above. What are the barometric pressure readings for each high and low centre?
A barometer is another tool that sailors use to help them forecast the weather. A barometer is an instrument that measures air pressure. Changes in pressure are what generate winds. A dropping or falling barometer means an approaching low pressure system or front and its associated bad weather. A rising barometer means an approaching high pressure system and fair weather (but lighter or calm winds). Together with the weather forecast, a barometer is a great tool to help you to predict approaching weather.
Weather Forecast Maps (progs)
As mentioned before, computer models are used to estimate future weather. These look similar to (and you use them the same way as) the maps described above, except that they have Valid Times (V) in the future. Here are links to get forecast maps from the US (OPC) and Canada (ECCC):- Canadian ECCC: https://www.weather.gc.ca/model_forecast/index_e.html
- US OPC: https://ocean.weather.gov/Pac_tab.php
For example, the OPC web page above provide a graphical interface
(shown below) to get forecasts 24, 48, 72, and 96 hours (namely, 1, 2,
3, &
4 days) into the future. (Don't memorize these. Instead, be
aware that forecast maps exist for different numbers of days into the
future.)
I would not trust any Pacific forecast beyond 1 to 2 days in winter. In summer, the weather is quieter and moves more slowly, so good forecast skill in the Pacific extends to 3 to 5 days in the future.
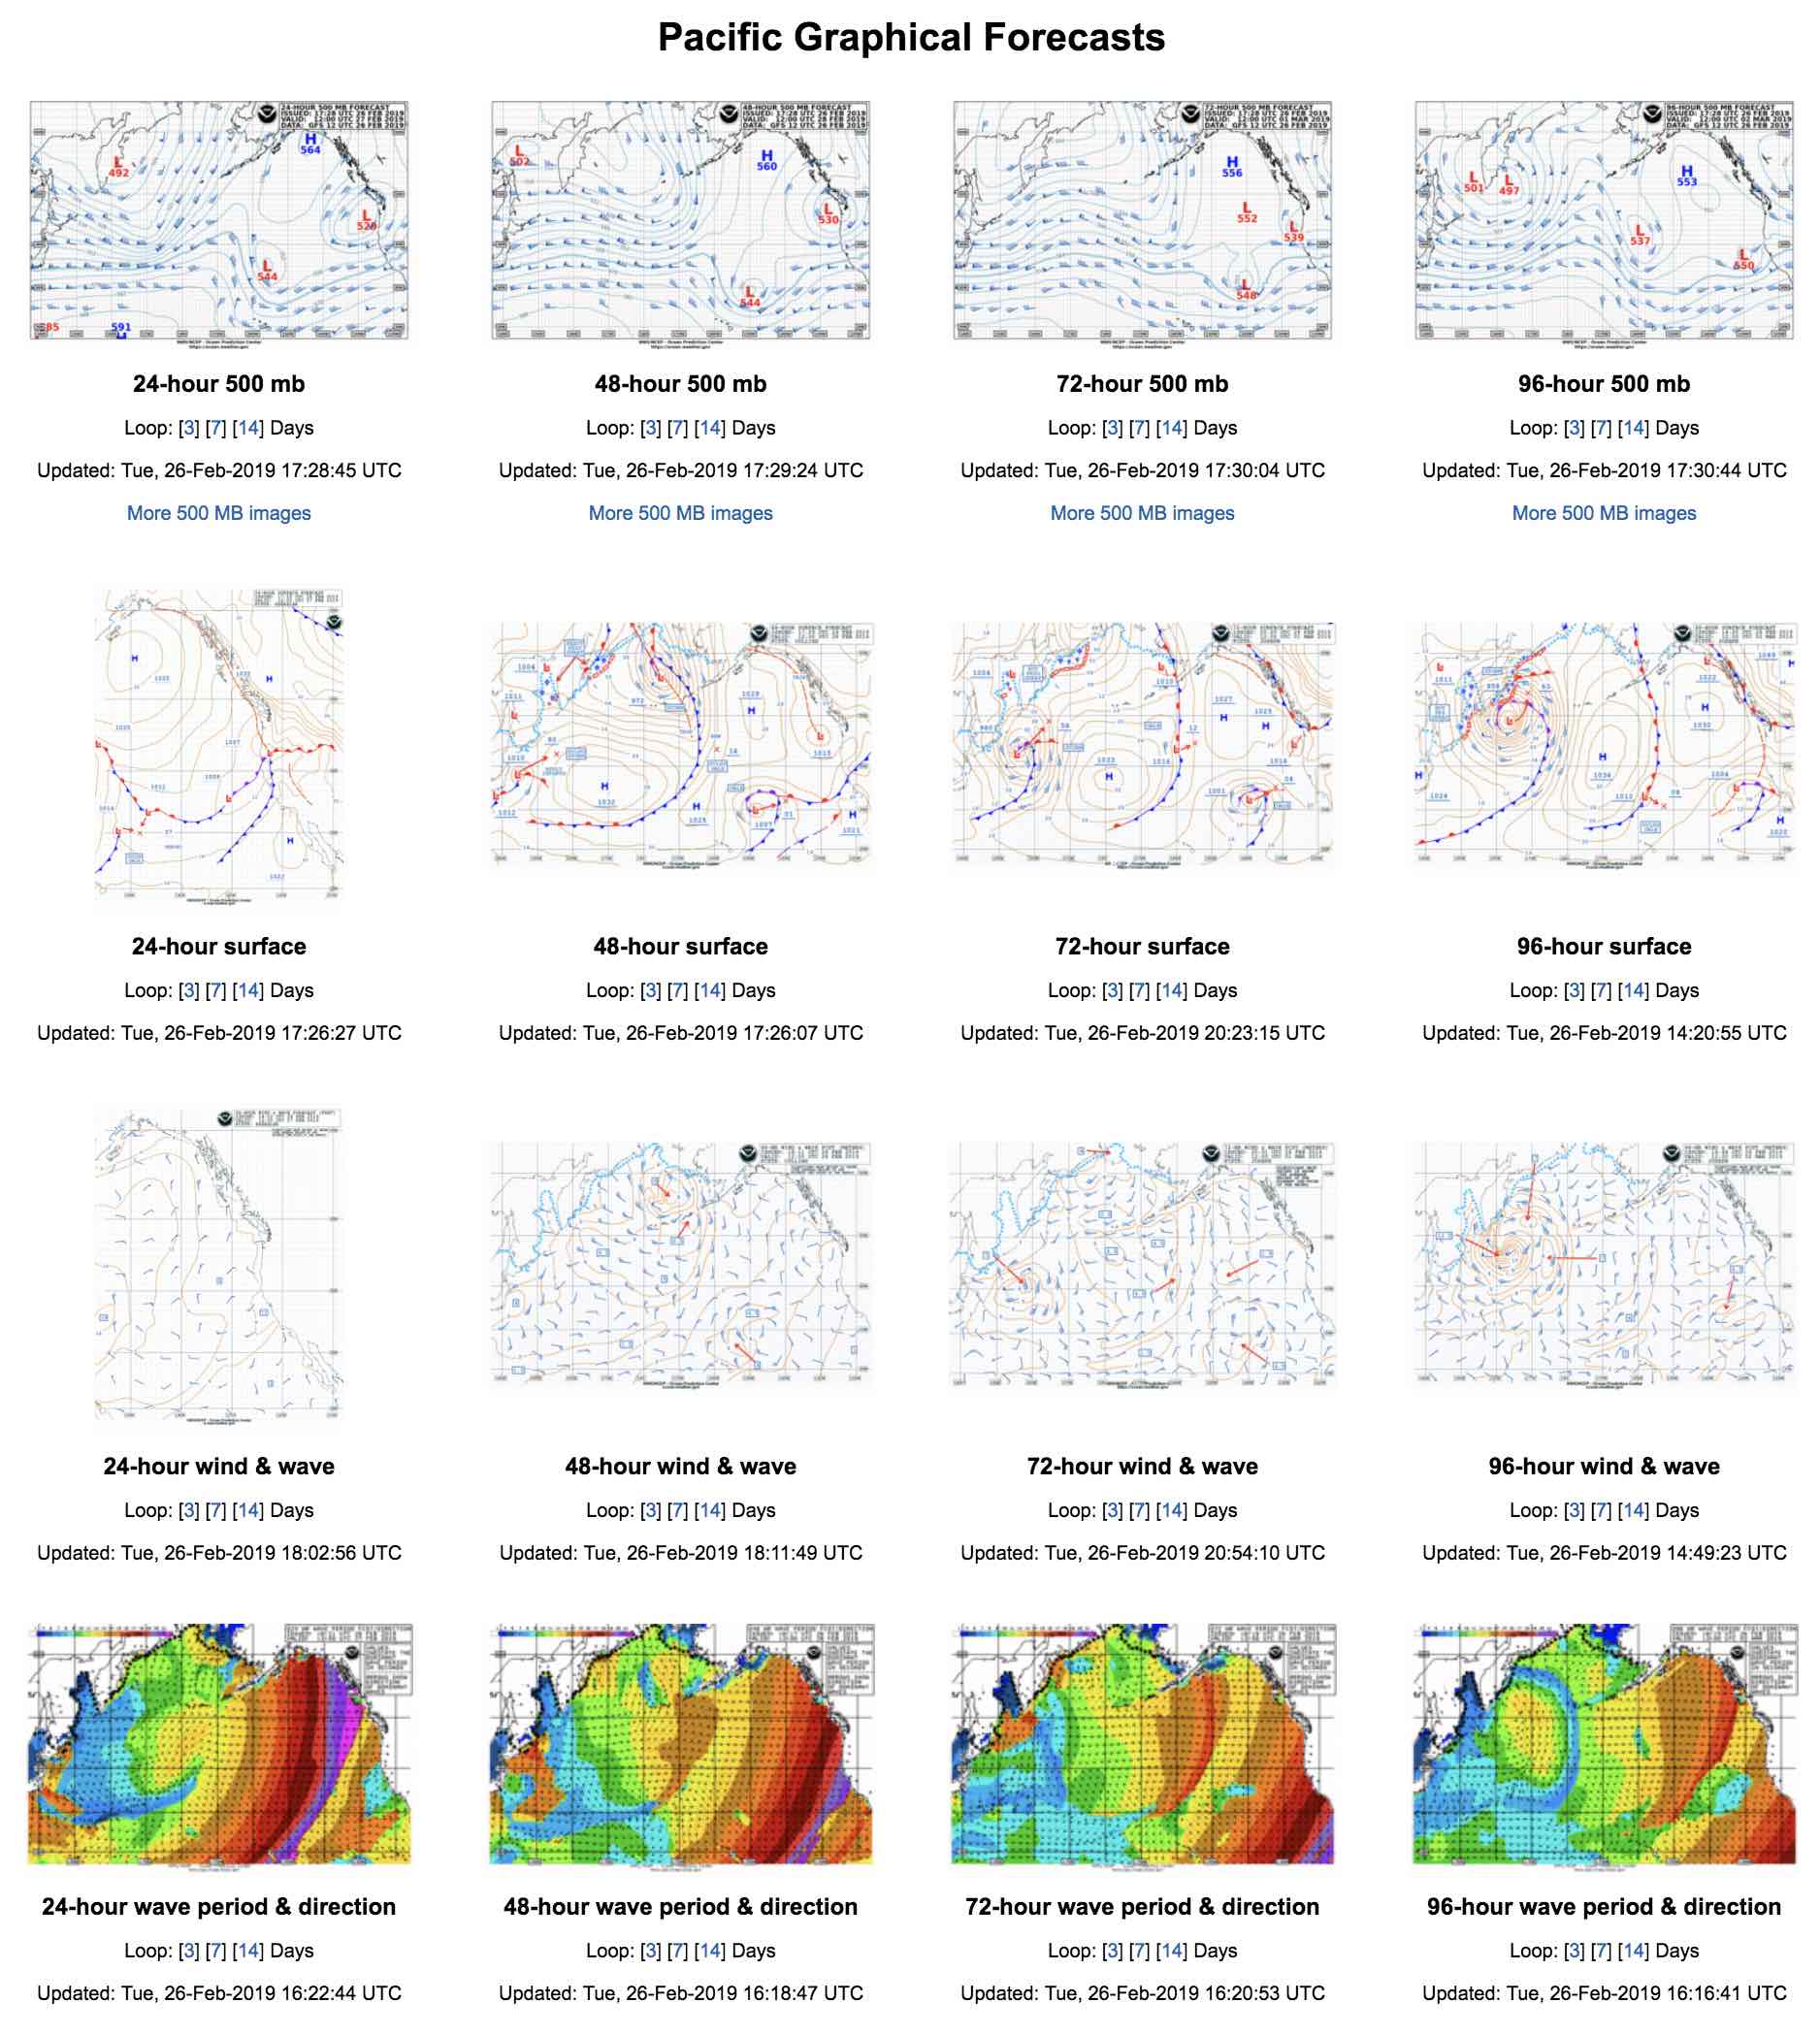
Sample of forecast maps that are available for Pacific Ocean weather. Source: US OPC: https://ocean.weather.gov/Pac_tab.shtml
Additional Resources: (non-required material)
Weather Front Simulations: http://www.phschool.com/atschool/phsciexp/active_art/weather_fronts/
NOAA Ocean Prediction Centre – weather maps: https://ocean.weather.gov/Pac_tab.php
Videos: (non-required material)
How to read a synoptic chart: https://www.youtube.com/watch?v=wl_FFK_HbjY
Keywords: analysis maps, forecast maps (progs), valid time, cold front, warm front, occluded front,
stationary front, TROWAL, isobars, barometer, kiloPascal, ECCC, OPC
Image credits: are given near the images. Where not listed, the photos are by Samantha James.