ATSC 113 Weather for Sailing, Flying & Snow Sports
Tide and Current Tables
Learning Goal 11e: Interpret different tides and currents from tide and current tables.
Tide stations measure the rise and fall of the oceans at specific locations and can help those on the water predict the timing of high and low tides. Tide tables or charts list the daily high and low tides for all the tide stations in a given area for an entire year. Current tables list the maximum flood and ebb and the times of high and low slack current. When out on the water, it is important to have access to the tide tables in your area so you can plan your trip accordingly.
Using Tide Tables
Tide tables are produced by Fisheries and Oceans Canada and are available online or in print form. They are split into seven different volumes for the different regions of Canadian waters. Find the volume that applies to the area you will be sailing in. Tides for the Strait of Georgia are in Volume 5. Within this volume, you will find the annual tides for each tide station. Let’s look at an example tide table for Gibsons on the Sunshine Coast.
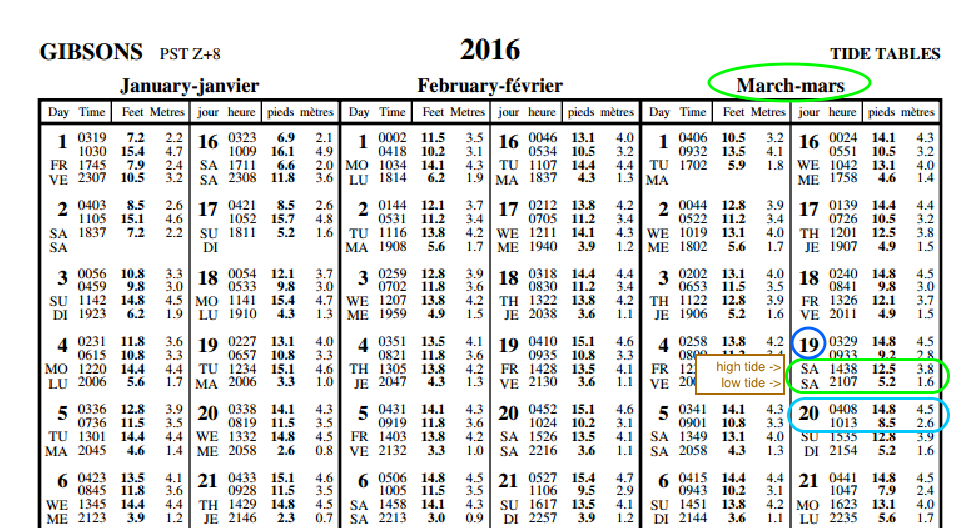
The table provides the date, the day of the week, the time (24 hour
clock) of high and low tides, and the height of the tide in feet and
meters. If you are an English reader, then interpret "jour" as "day",
interpret "heure" as "hour or time", and interpret "pieds" as
"feet".
The heights refer to the height of the water above chart datum. Chart datum is typically the lowest average tide, below which the tide will rarely fall. It is not the seafloor. If you look at a nautical chart, the depths indicated in small numbers along the contours are the depth of the water above chart datum. When it reads 11 ft, for example, this means that the depth at that location is still 11 ft at the lowest possible tide. You then add the height listed in your tide table to this value to get your actual depth at a given time on a given day.
Let’s say you’re sailing to Gibsons on Saturday, March 19 and want to know what the tide will be doing Saturday evening and Sunday morning so you can decide where to anchor and how much anchor chain to put out (use the Gibsons Tide Table above). You will need to know the biggest tide difference to make sure you are anchored in deep enough water and to make sure you put out enough anchor chain to ensure the safety of the boat overnight.
If you anchor in 30ft of water at 14:30, the height of the water above chart datum will be about 12.5 ft (as read from the tide table, outlined in green). The tide is going to drop down to 5.2 ft at 21:07, meaning the water level is changing by the difference between the two tides, in this case by 7.3 ft. While you anchored in 30ft of water in the afternoon, by 21:07 you will be anchored in 22.7 (=30 - 7.3) ft of water. The tide will then rise by 9.6 ft (going from 5.2 to 14.8 ft) and then will drop again by 6.3 ft (going from 14.8 to 8.5 ft, see outline in light blue on the tide table).
Therefore, when you drop your anchor in 30 ft of water at 14:30, you know that you will lower to 7.3 ft below your current depth (at around 2100 on Mar 19), then be 2.3 ft above (at around 0400 on Mar 20) your current depth over the course of the evening. In summary, the shallowest water you will be anchored in will be 22.7 ft and the deepest will be 32.3 ft. Knowing this, you will have sufficient depth beneath your boat and you can put out an appropriate amount of anchor chain.
NOTE: Technically, you would add an hour to these times to account for Daylight Savings. Tide and current tables are given in Pacific Standard Time yet from spring to fall, we operate on Pacific Daylight Time.
Using Current Tables
Current tables appear much the same as tide tables, but the numbers indicate the speed of water in knots rather than the height of water. Let’s look at the current tables for Sechelt for the same time period:
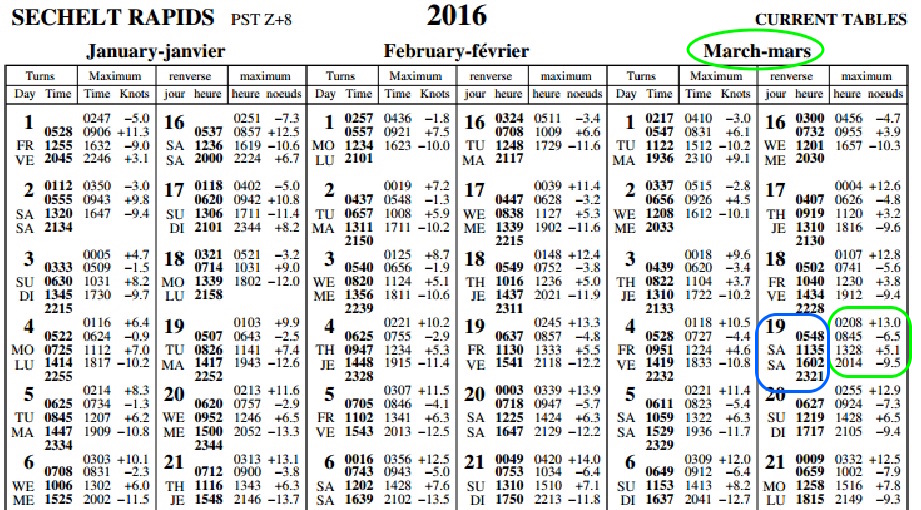
On March 19, there are two maximum flood currents and two maximum
ebb currents (outlined in green)
that
correspond with the high and low tides. The flood current is indicated
with a + sign and the ebb current is indicated with a – sign. The
biggest maximum flood is at 02:08 in the morning with 13.0 knots of
current coming in with the rising tide. The
biggest maximum ebb is at 20:14 in the evening with 9.5 knots of
current flowing out with the outgoing / falling tide. Notice that
there are two time columns.
The bolded column indicates the time of slack (i.e., zero) current. For the example outlined in blue on the current table: "high slack" currents (namely, zero current when the tide reaches high tide and then reverses and starts to ebb) are at 05:48 and 16:02, and "low slack" currents (namely, zero current when the tide reaches low tide and then reverses and starts to flood or rise) at 11:35 and 23:21.
Current tables — a brief review:
In reading the current tables, you can tell if the bolded value is high
or low slack by referring to the +/- information on the current speed
(knots). The data are presented in the table so that you have the time
of slack current in bold on the left, then the time of maximum current,
then the speed of that maximum current in knots on the right. So, you
kind of read the line from right to left.. if the max current speed is
-4.5 knots, the '-' tells you that the current is ebbing, or going out,
which means the bolded time on the left would have been the time at
which the tide was high and the current was at high slack before it
started to ebb. Inversely, if the current speed is +1.3 knots, the '+'
tells you that the water is flooding, or coming in, and the bolded time
on the left will be the time at which the tide was all the way out and
the current was at low slack before the tide started to flood or come
in.
Additional Resources: (non-required material)
Canadian Tide and Current Tables: https://charts.gc.ca/publications/tables-eng.html
Videos:
Reading and Interpreting a Tide Table: https://www.youtube.com/watch?v=0tpXUmBMe4w
Keywords: tide station, tide table, current table, flood, ebb, high slack, low slack
Image credits: are given near the images.
Figures annotated by R. Stull.