ATSC 113 Weather for Sailing, Flying & Snow Sports
Moisture Pressure-Level Maps
Learning Goal 5c. Interpret clouds and moisture from pressure-level maps, in terms of snow safety.
Pressure-level maps were introduced in Learning Goals 5a and 5b. In this Learning Goal we'll add moisture to the temperature and winds already plotted on the map (Fig. 5c.1).
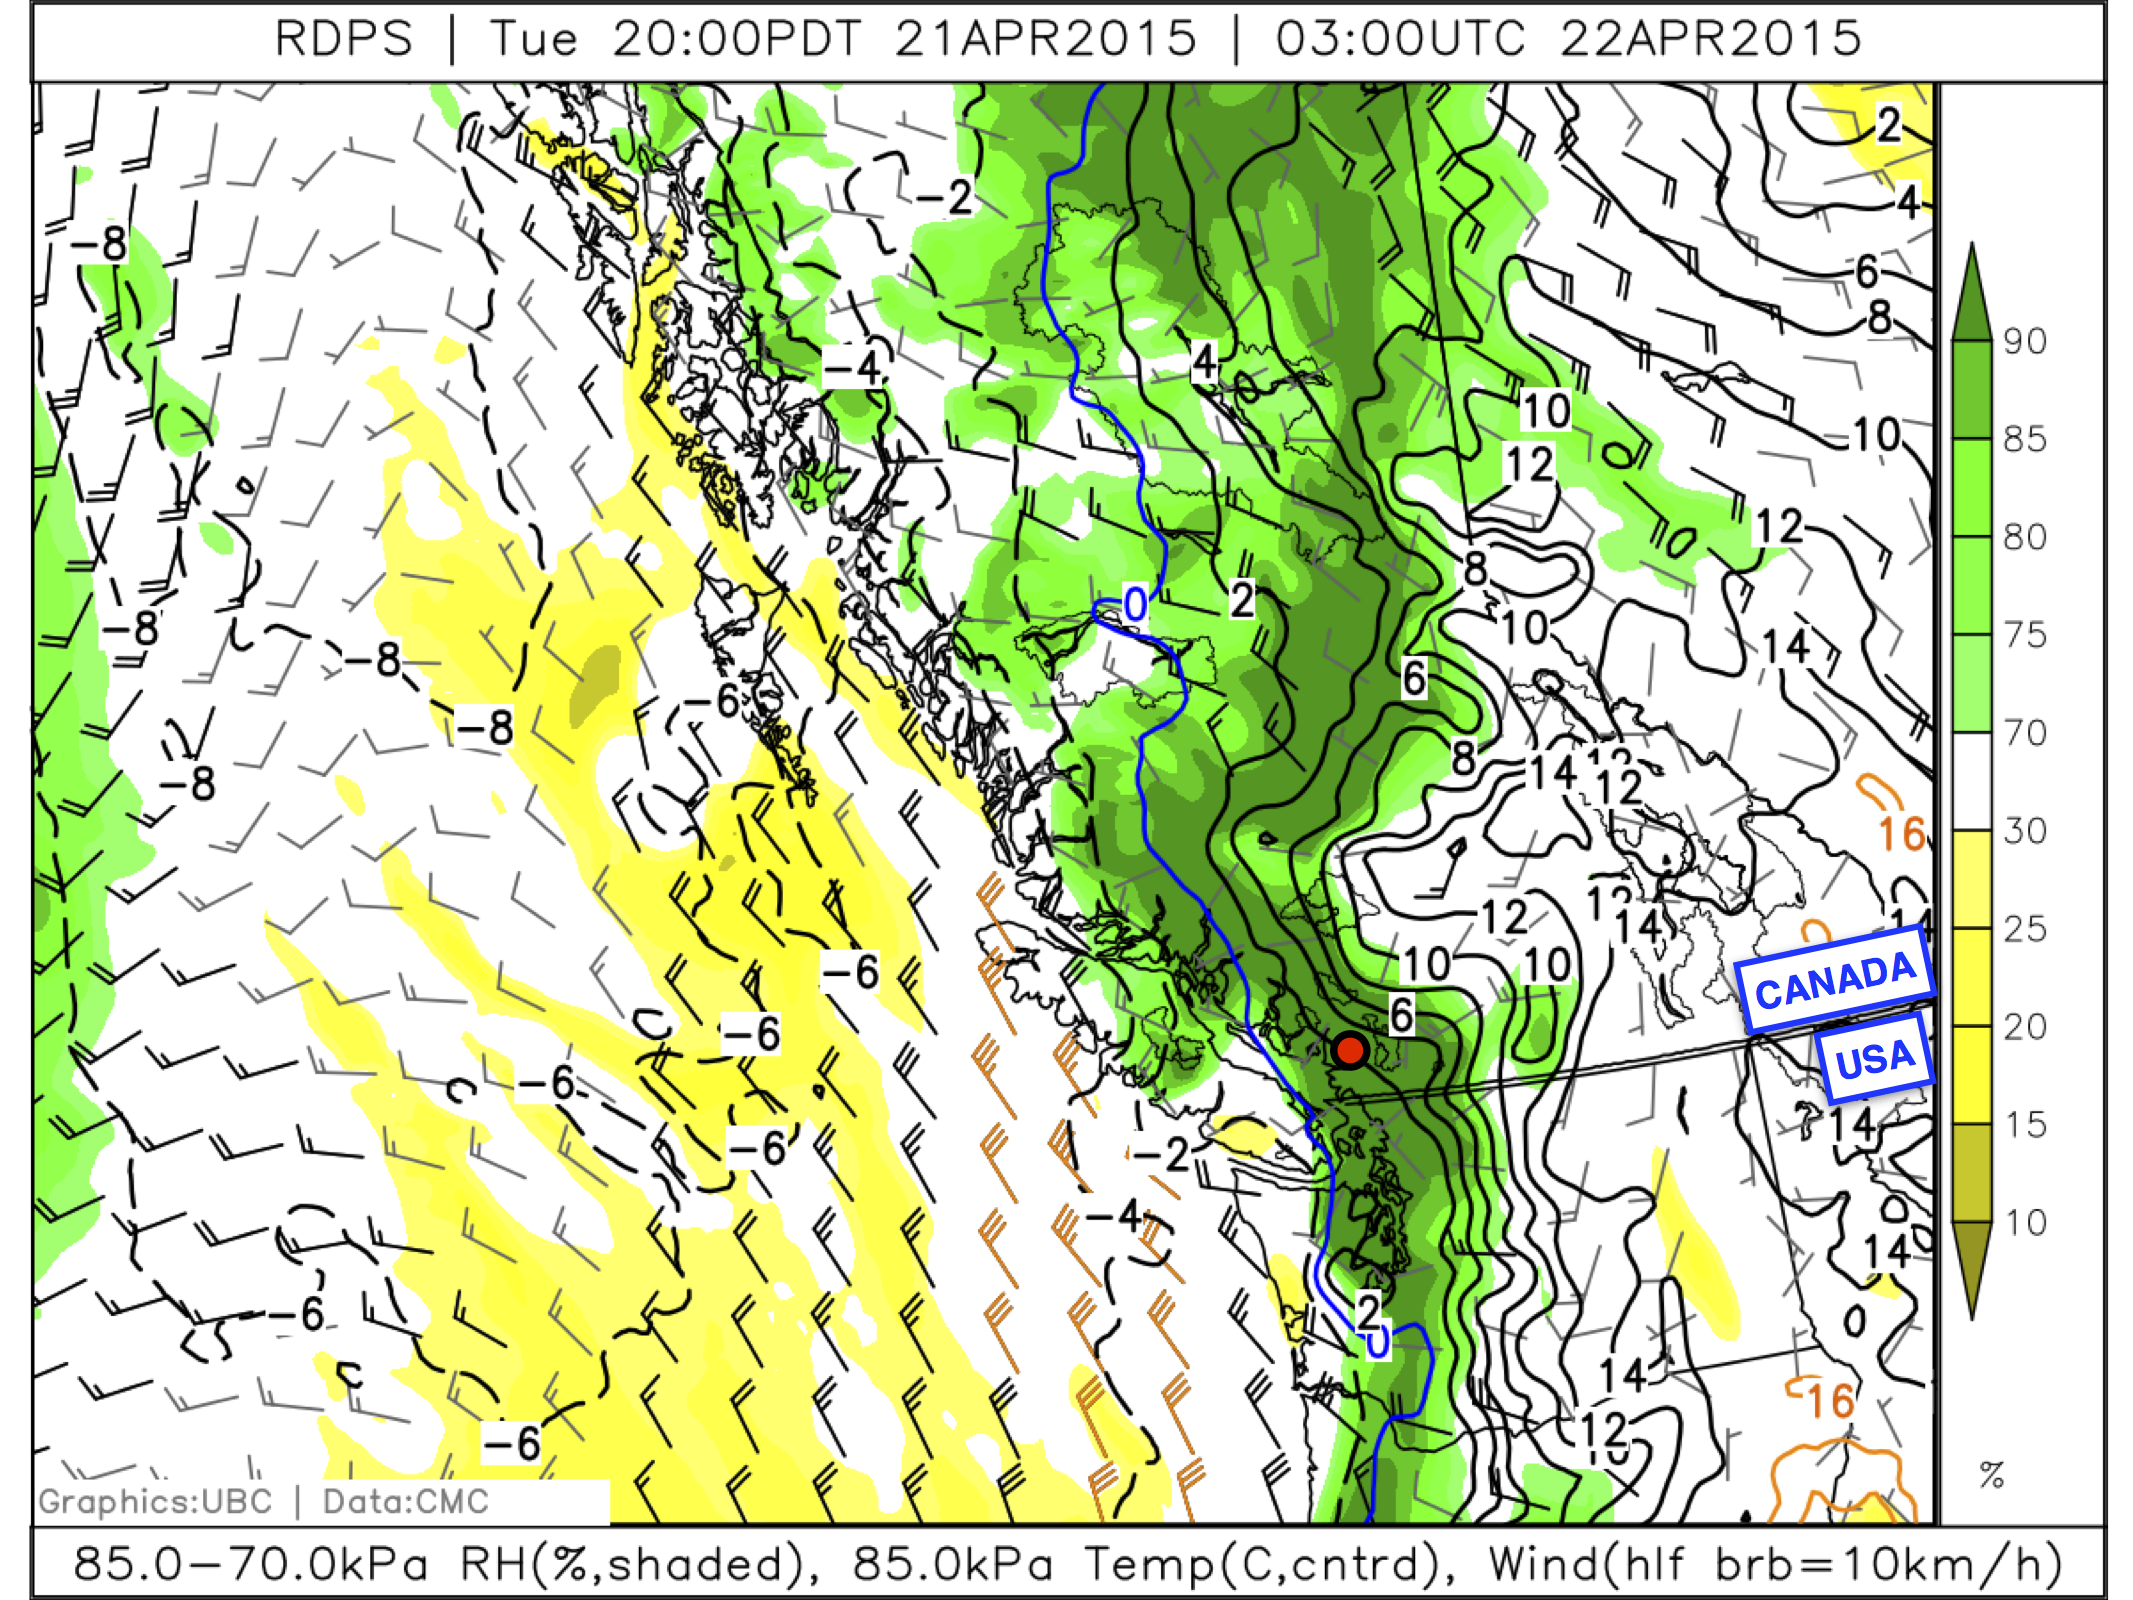
Fig. 5c.1 - A pressure-level map covering the northeast Pacific Ocean, BC, Washington, and some of Alberta. The shading indicates relative humidity (RH in %) according to the scale at the right. The contours show temperature (every 2°C). Wind is displayed with wind barbs. For your reference, Grouse Mountain (just north of Vancouver) is marked with a red circle. (Credit: West.)
Interpreting Moisture and Clouds
Clouds are not usually plotted directly on pressure-level maps. While some weather maps show total cloud cover, it can be important for skiers to differentiate between clouds at different elevations. So instead, we typically use some measure of moisture, most commonly relative humidity (RH), to represent clouds. To remind you, RH is the ratio of how much moisture is actually in the air to how much moisture the air is able to hold, expressed as a percentage.
Condensation (clouds or fog) begins to occur when RH reaches 100% (saturation). Remember that NWP models are only approximations of the atmosphere. We typically start seeing cloud formation in the real world when the forecast model says RH is ~70%. Expect overcast cloud cover if the model indicates a RH greater than 90%. If this moisture is at the elevation where you're skiing, then you will experience this as fog! For RH greater than 90%, you may have little to no visibility — not fun!
For example, in Fig. 5c.1 above, the dark green shading indicates RH > 90% over the southern Coast Mountains, including the North Shore Mountains. The 85.0-kPa map shown here is not far above the elevation of Grouse Mountain peak, which is at 1250 m, so it's a good bet that skiers on Grouse would have overcast and likely foggy conditions yielding poor visibility, like in Fig. 5c.2.
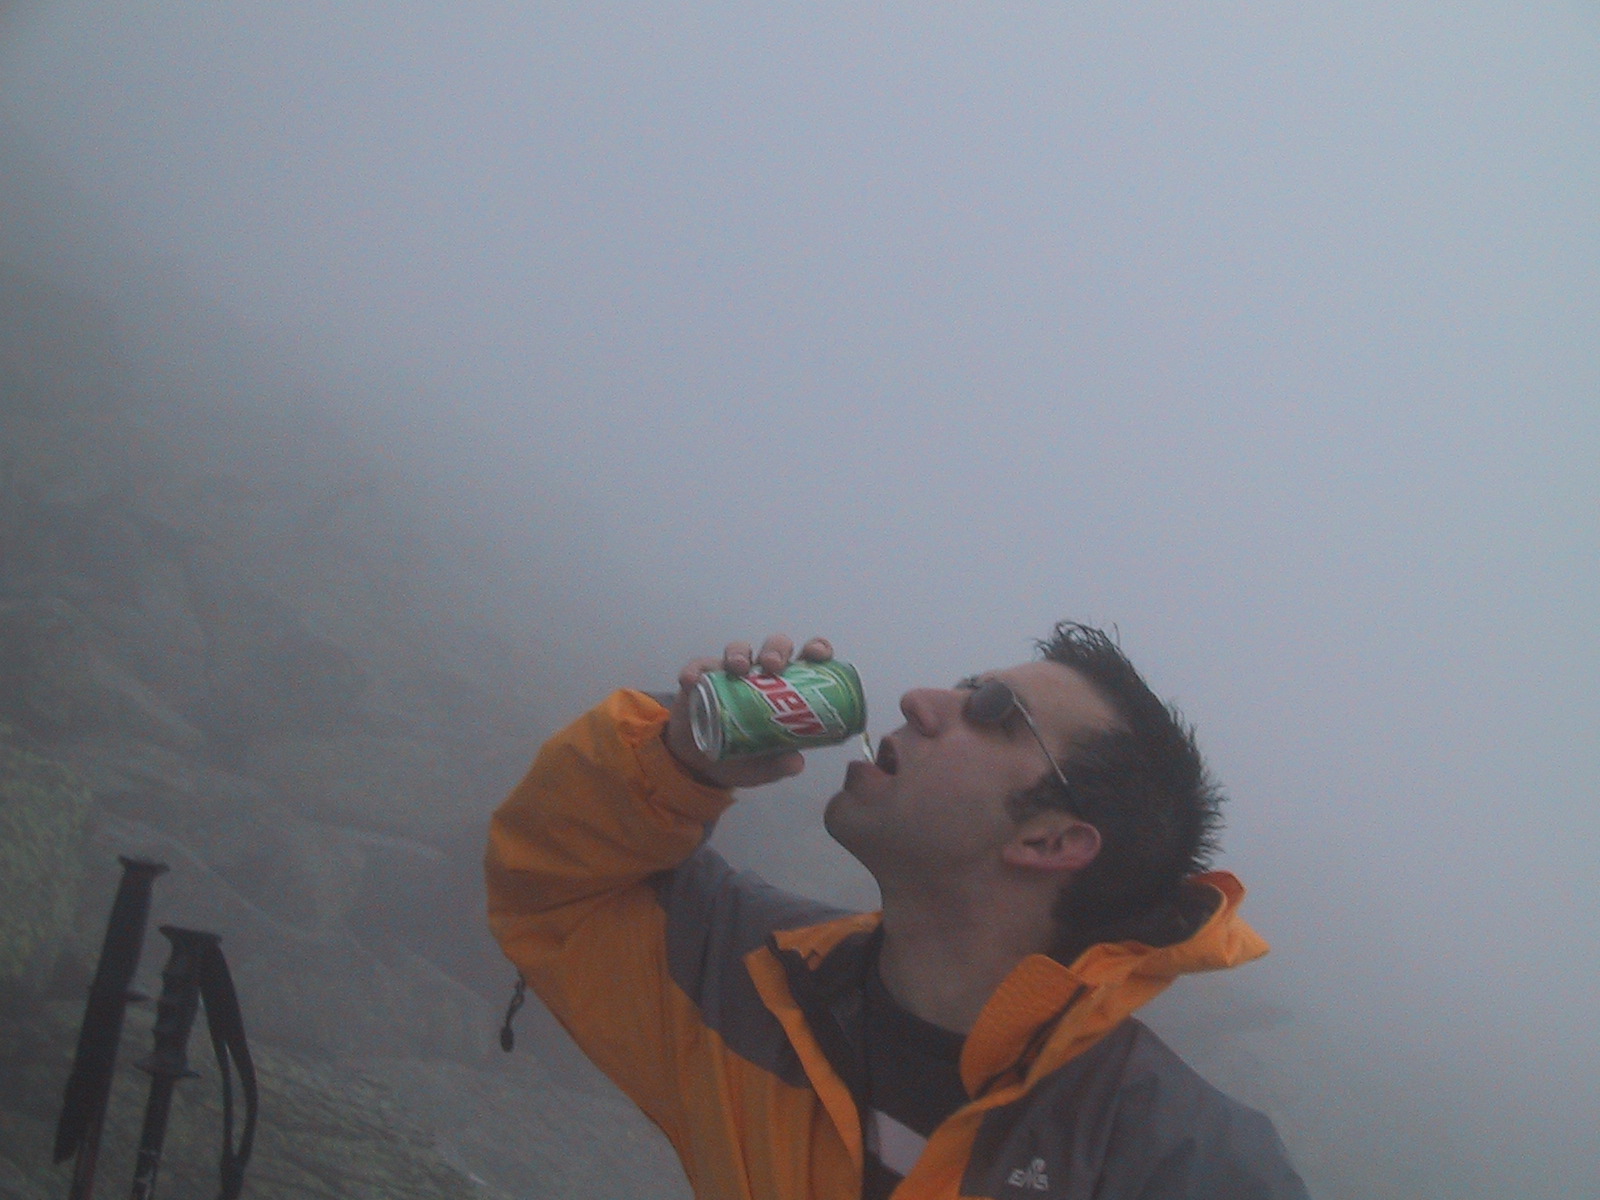
Fig. 5c.2 - Killing time, "Doin' the Dew", while socked in the fog/clouds on Mount Washington, NH, USA. This is what an RH > 90% model forecast at your pressure level looks like (if the model is accurate). (Credit: West.)
If the moisture is above your elevation, you'll experience cloudy or overcast skies above (Fig. 5c.3).
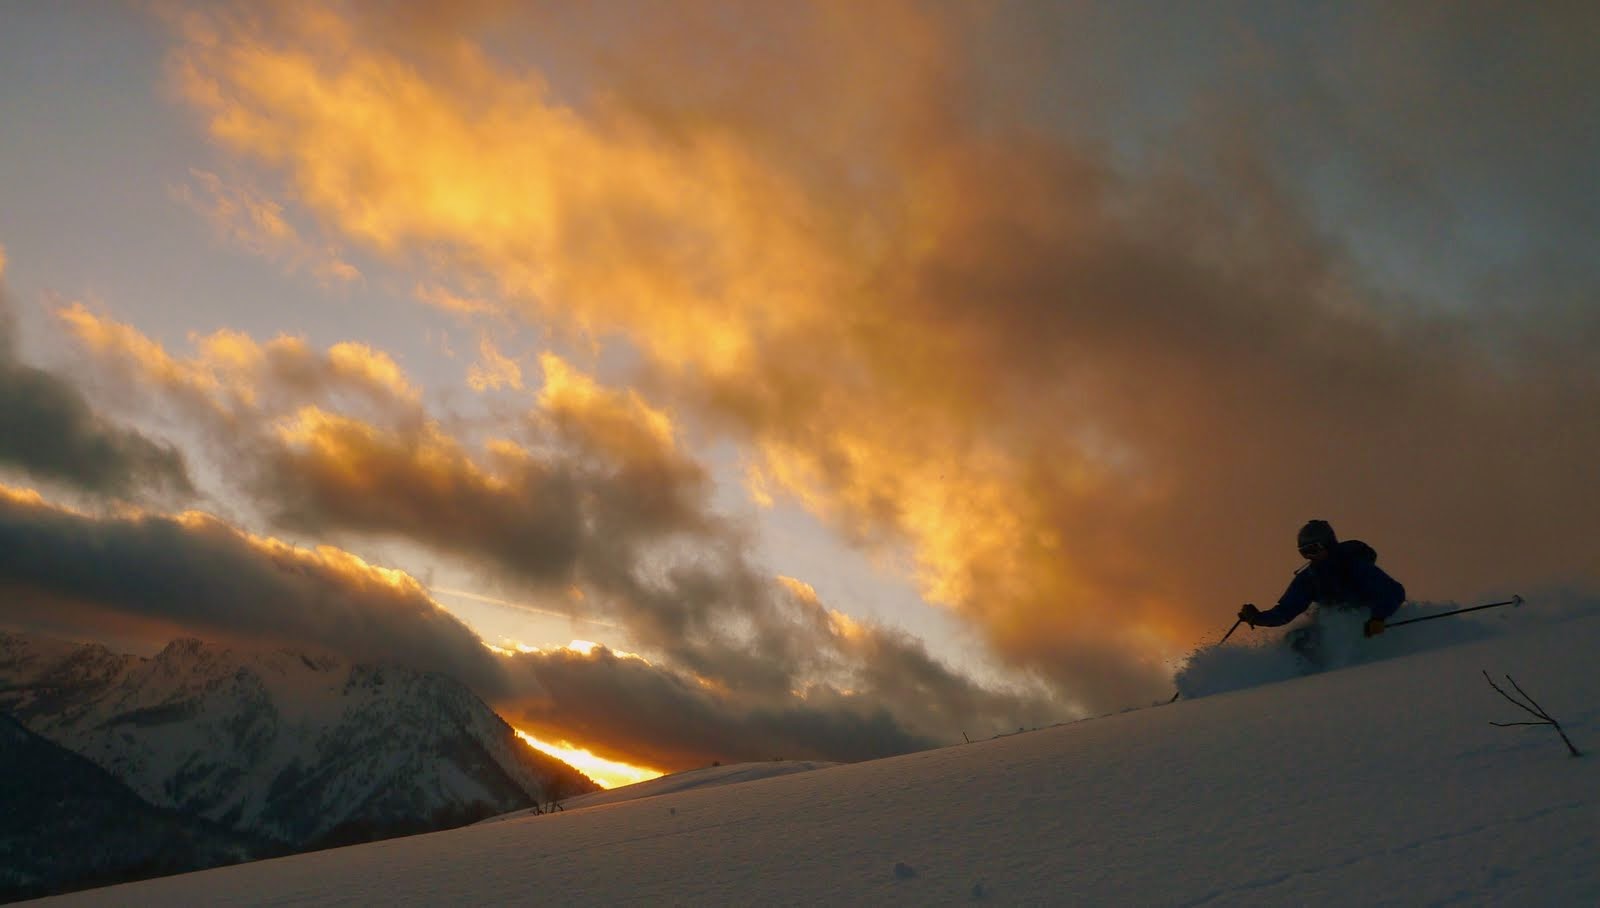
Fig. 5c.3 - Partly cloudy skies above, at sunset, in Big Cottonwood Canyon, UT, USA. The model forecasted 80% RH for the the 70.0-kPa pressure level, 300 m above the skiing elevation. (Credit: West.)
If the moisture is below the level at which you're skiing, the clouds may be below you. When there is an "overcast" (unbroken) cloud layer below you, it's called an undercast (Fig. 5c.4).
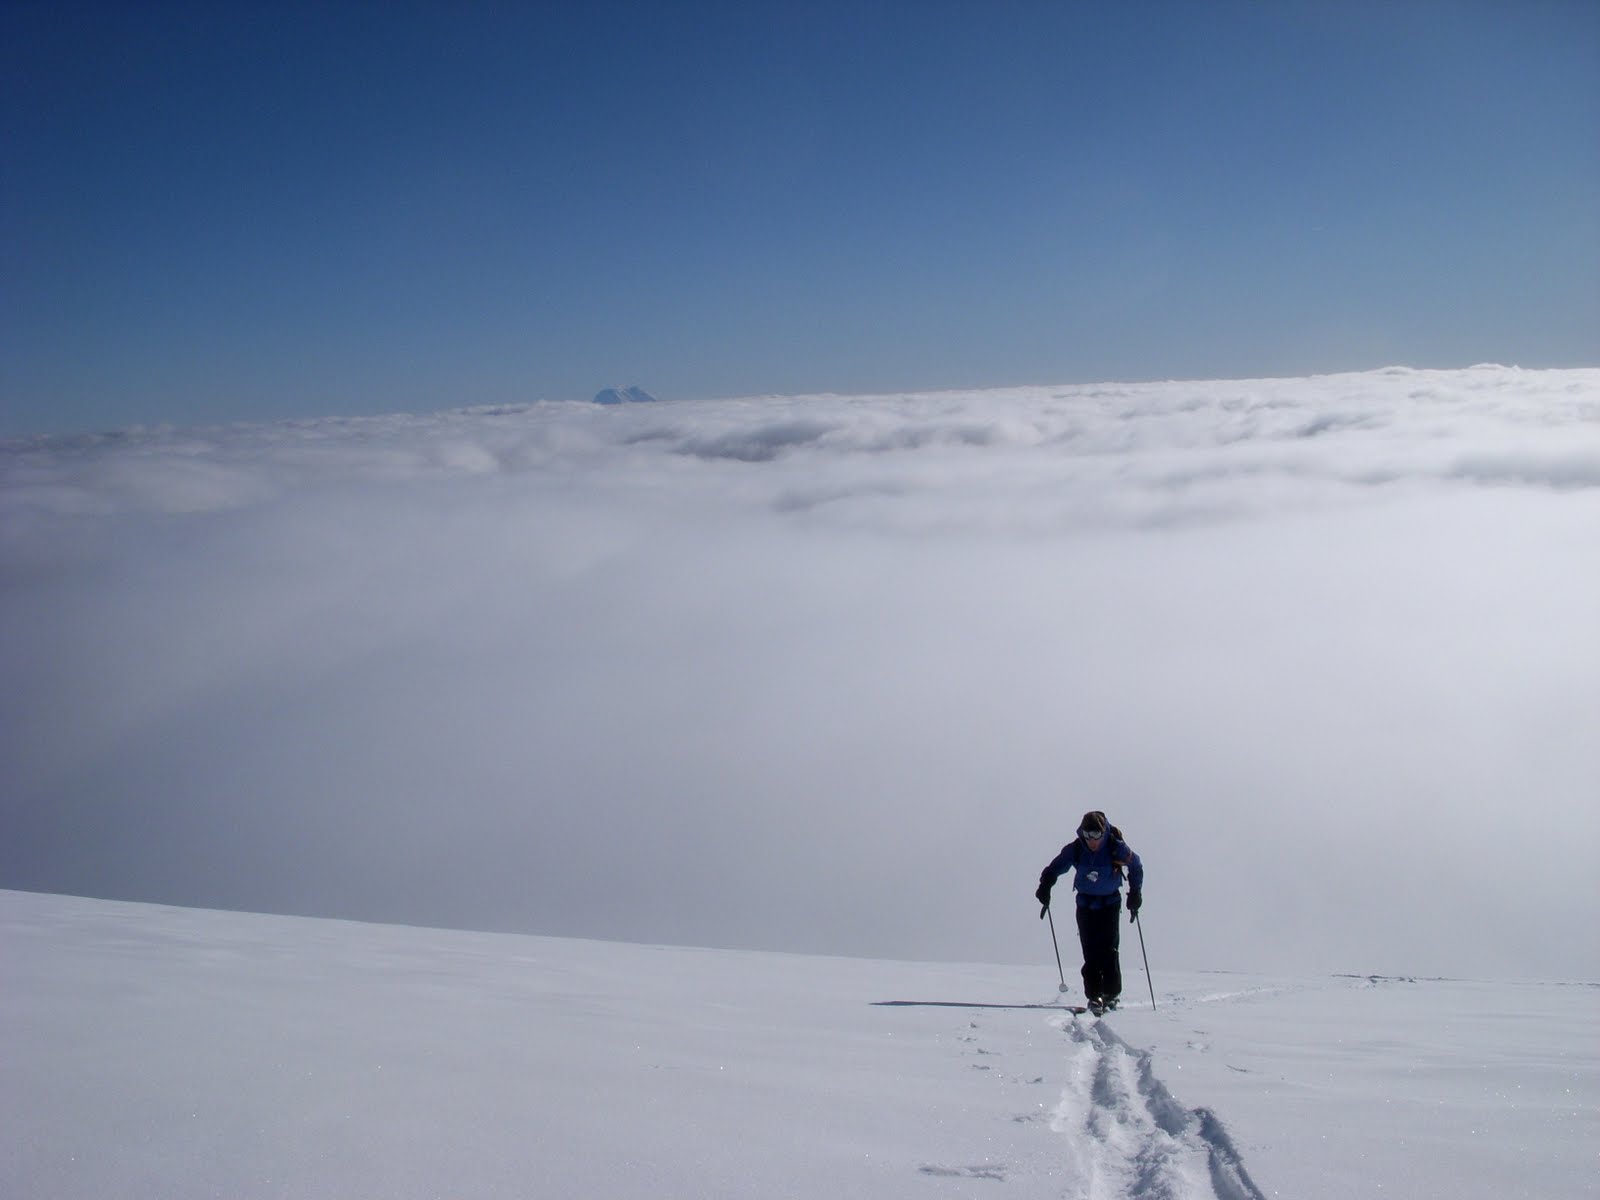
Fig. 5c.4 - Skinning above an undercast on Mount Rainier, WA, USA. Mount Adams is just barely visible poking above the undercast on the horizon in the distance. In this case RH is 100%, just 100 m below the skiers, but the atmosphere is dry above this, creating a beautiful day up high. (Credit: West.)
Less than 50% RH means you can have confidence in cloud-free conditions at that level of the atmosphere. For example, in Fig. 5c.1, the air at 85.0-kPa level off the BC Coast in Fig. 5c.1 would very likely be cloud-free.
Key words: relative humidity, condensation, undercast
Figure Credits: Stull: Roland Stull, West: Greg West, Howard: Rosie Howard