Low Pressure
Learning Goal 5d. Use your knowledge of mean sea level pressure to identify low pressure systems and troughs on pressure maps.
Learning Goal 5m. List and describe weather conditions relating to low pressure systems that are hazardous to skiers.
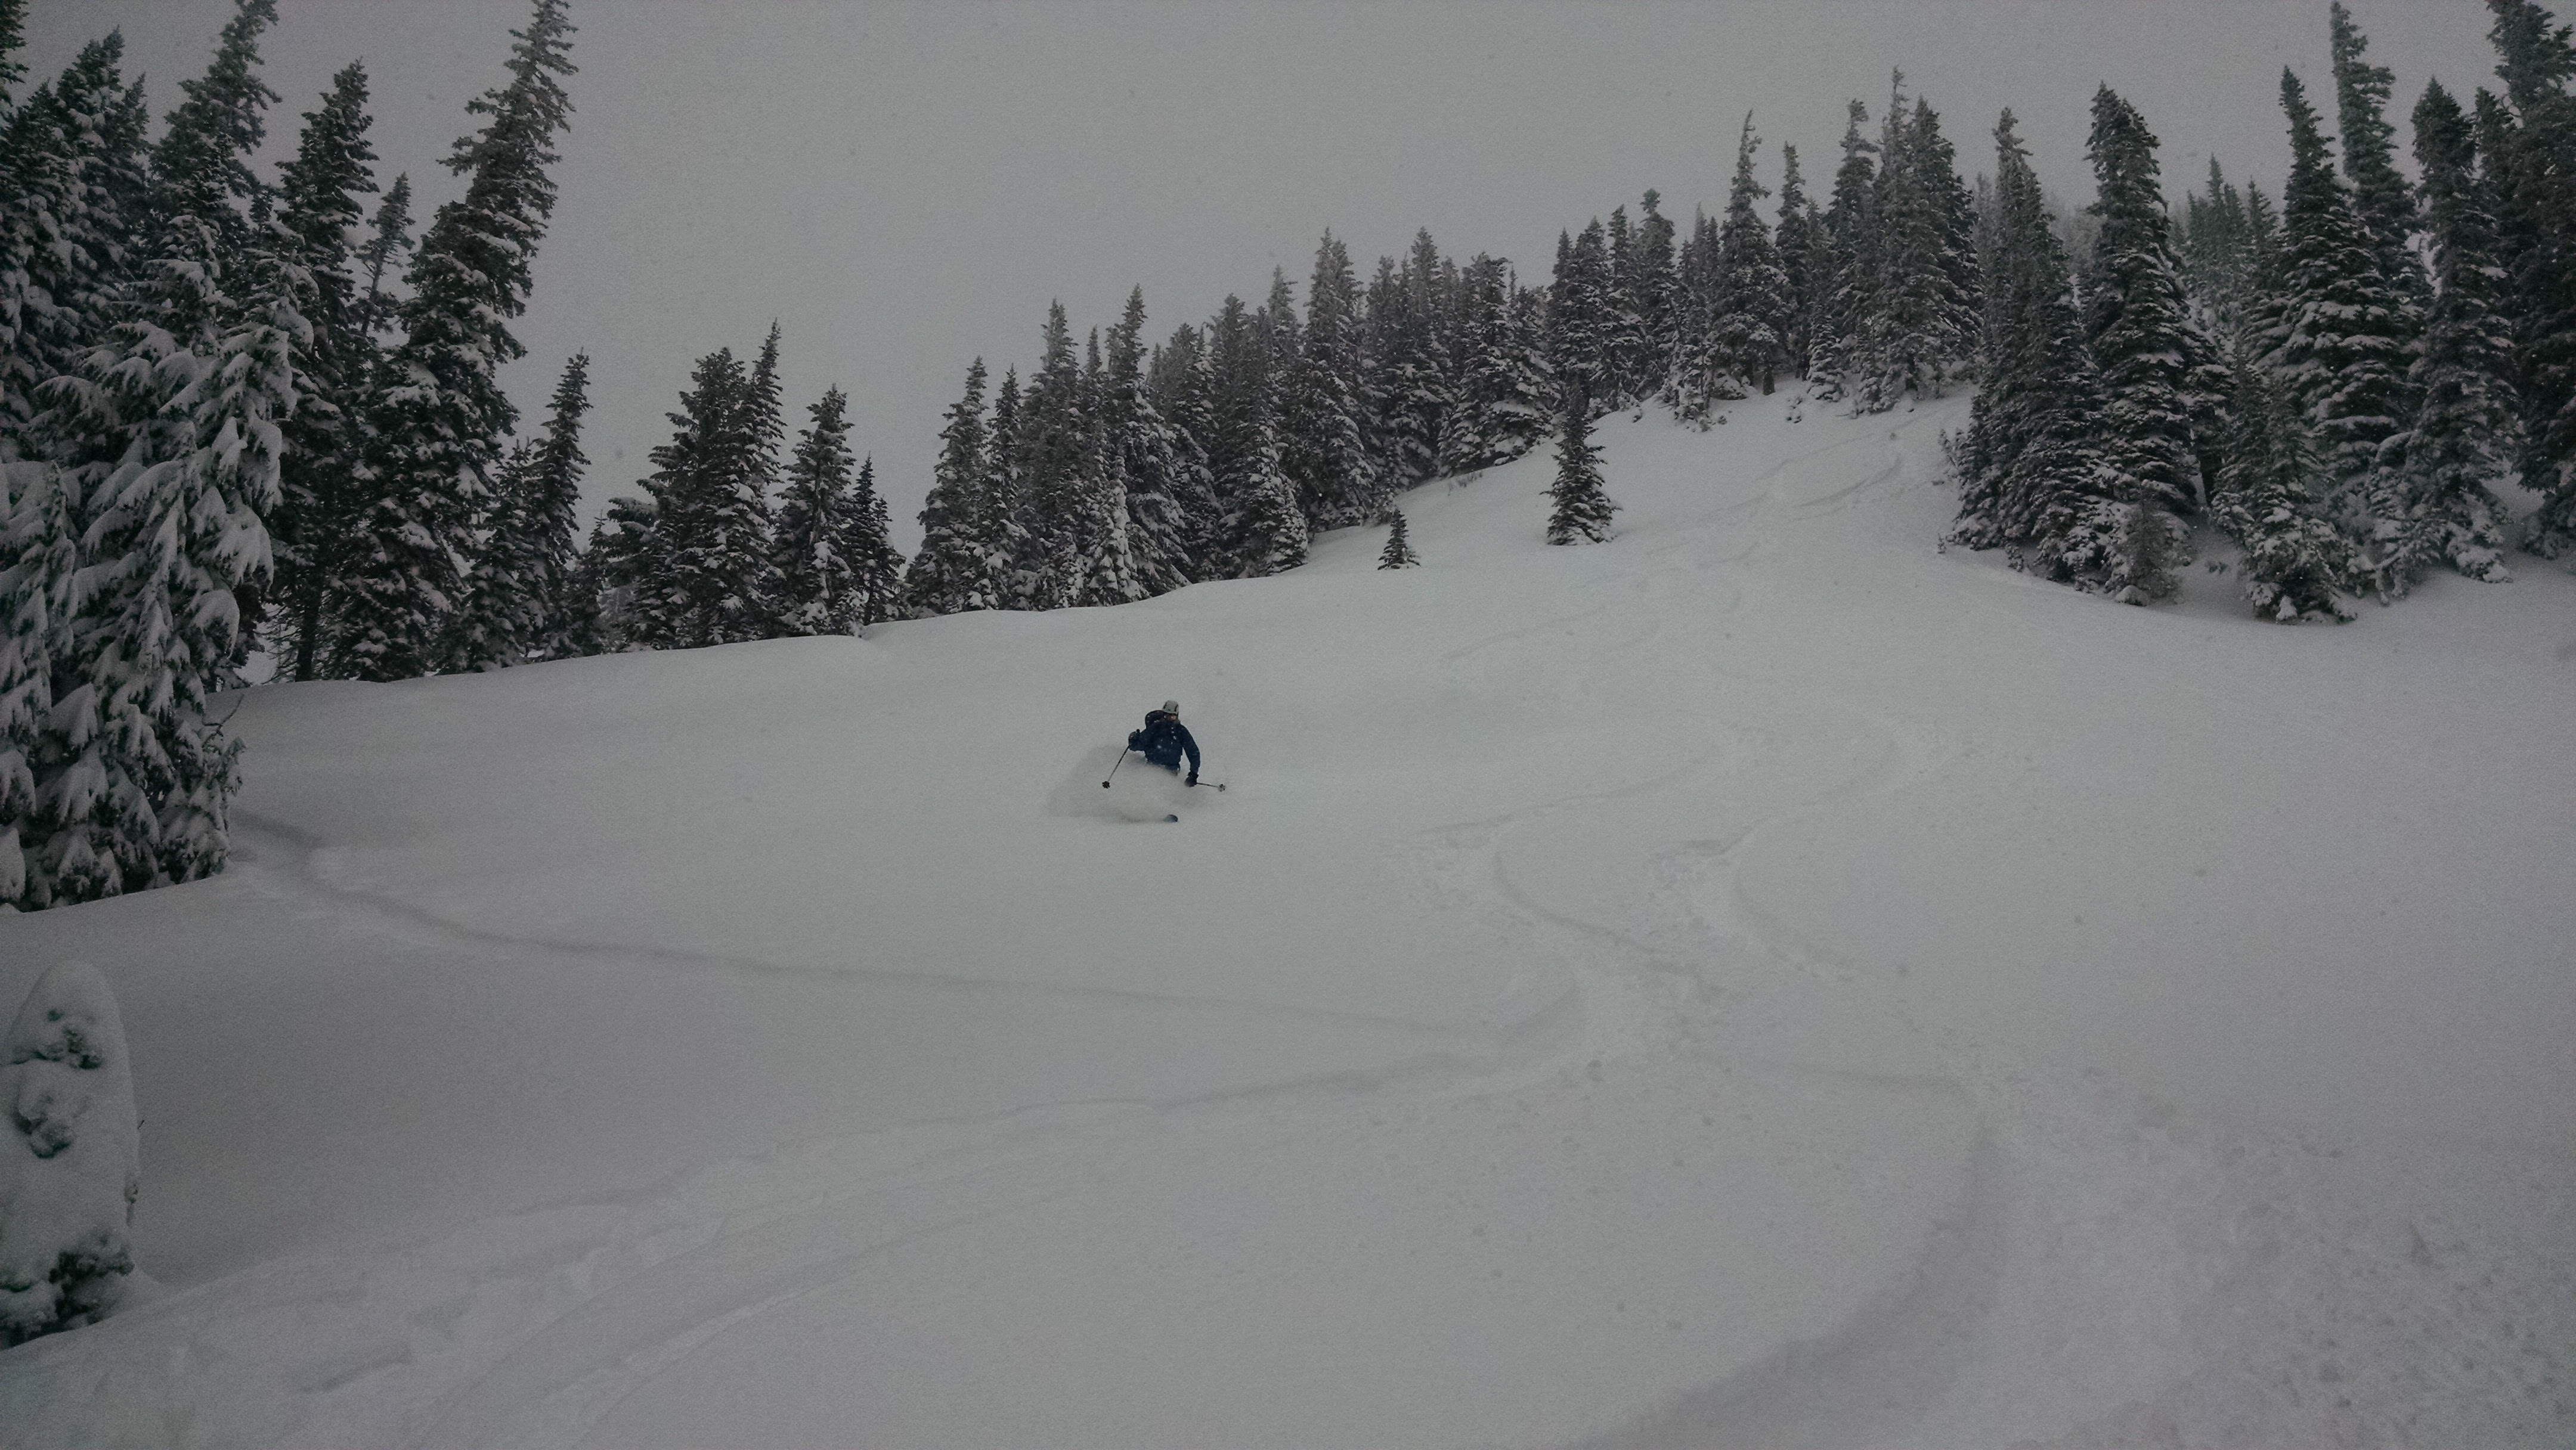
Fig. 5dm.1 - Storm day powder skiing on Nak Peak, BC. (Credit: West)
-
What kind of weather does a low pressure system bring?
Low pressure systems, also referred to as cyclones, are associated with bad weather. This can include heavy precipitation (i.e. rain and snow), strong winds, and low visibility. These weather conditions can be the most difficult and hazardous to ski in. In order to make smart decisions and ski safely, you'll need to know how to identify a low pressure system. That way you can use forecast maps to see them coming!
-
Identifying lows and troughs by pressure pattern
Recall that pressure is determined by the weight of the air above you. Low pressure, or a low pressure system, is a region where air pressure is lower than in surrounding regions. Weather maps on TV and the Internet often show a surface low as an "L", with concentric isobars (introduced in learning goal 5ei) indicating how the pressure varies around the low.
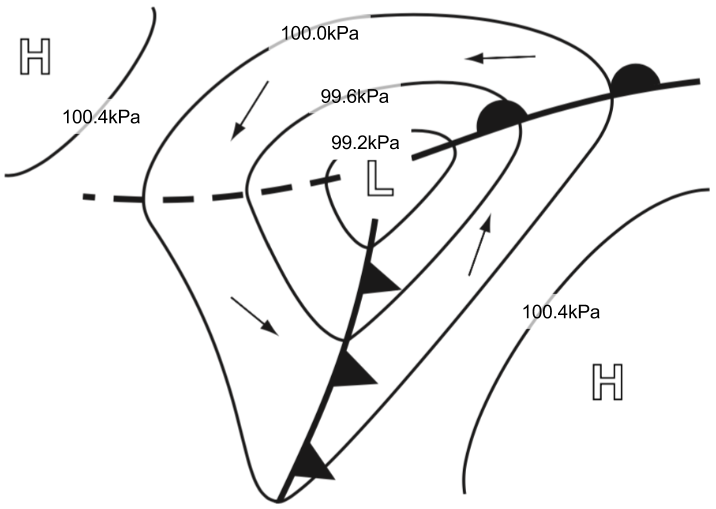
Fig. 5dm.3 - Surface weather map for the Northern Hemisphere with isobars showing a low pressure centre in the middle, surrounded by regions of higher pressure. The winds travel counterclockwise around the low pressure. The thicker black lines with triangles and semi-circles denote fronts, not covered in this section. (Credit: Stull)
On the real world weather maps, pressure patterns are more complicated. Pressure patterns are more complex, with some well-defined lows, and many more ambiguous lows and low pressure troughs. Also, not all isobars are labelled. Often the "L"s and "H"s are not placed on the map for you.
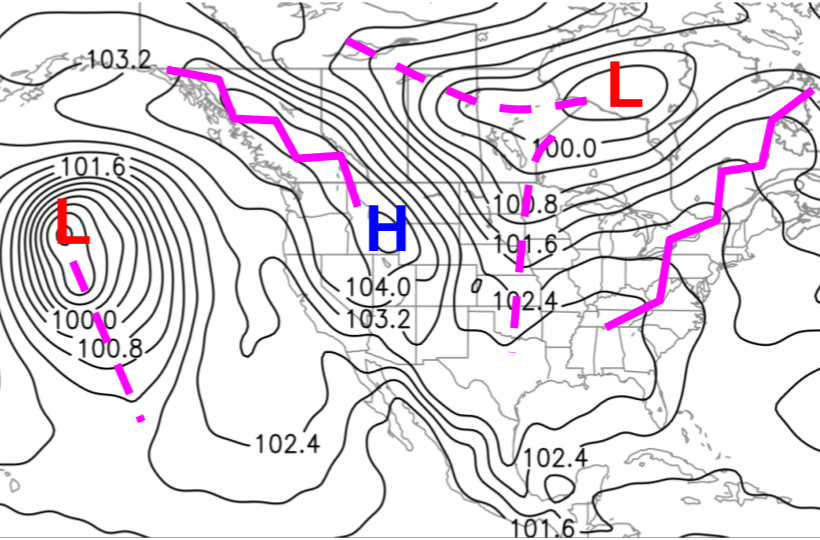
Fig. 5dm.4 - Real world surface weather map for North America. It shows sea level pressure (SLP, contoured). Low pressure troughs are marked with dashed lines (high pressure ridges are marked with squiggly lines). Each red "L" indicates a Low pressure centre. The blue "H" marks a High pressure centre. (Credit: West)
Low pressure centres, or lows, are areas of low pressure that are completely surrounded by higher pressure. As a result, they are completely encircled by at least one isobar. Lows can be identified by isobars of decreasing pressure with the inner-most isobar encircling the low centre.
Low pressure troughs are areas of lower pressure that are not completely surrounded by higher pressure. For example, let's look at the low pressure trough in the middle of the US, indicated by the dashed line (Fig. 5dm.4). If you travel directly from west to east across (horizontally, perpendicular to) the dashed lined, how does the pressure vary? Look at the second dash from the bottom. The isobar value just west of the dash is 102.0 kPa (not explicitly labeled). Under the dash, the isobar is labeled 101.6 kPa, a lower value. To the east, you again find the 102.0-kPa isobar. As you can see, the dashed line (the trough axis) is a minimum in pressure along that path across the trough axis. Notice that if you travel northward along the trough axis, pressures decrease towards the low pressure centre (labeled "L"). Low pressure troughs can be identified by "kinks" in the isobars, pointing away from the low pressure centre. If you're familiar with topographical maps, these are equivalent to valleys or gullies.
-
Why lows and troughs are associated with hazardous weather
Winds converge towards the centre of the low since, as a rule, wind blows from regions of high pressure to low pressure. In the Northern Hemisphere, the Coriolis effect turns these winds to the right, and so the air rotates counterclockwise around a cyclone (Fig. 5dm.3). This is the opposite to a high pressure system.
Fig. 5dm.6 - Wind in a low pressure system converges at low levels, spiraling in to the right, or cyclonically, creating a counter-clockwise circulation, and then upwards. (Credit: COMET/UCAR)
The converging air that moves towards the centre of the low at the surface has only one place to go: up (Fig. 5dm.6). Upward motion in a moist atmosphere generally results in clouds and precipitation, and the bad weather mentioned earlier. The fronts you see in Fig. 5dm.3 are usually only associated with low pressure systems. General background information on fronts is covered in the Flying Learning Goal 3h, and we'll discuss the types of weather associated with fronts in Snow Sports Learning Goals 5f (warm fronts) and 5g (cold fronts).
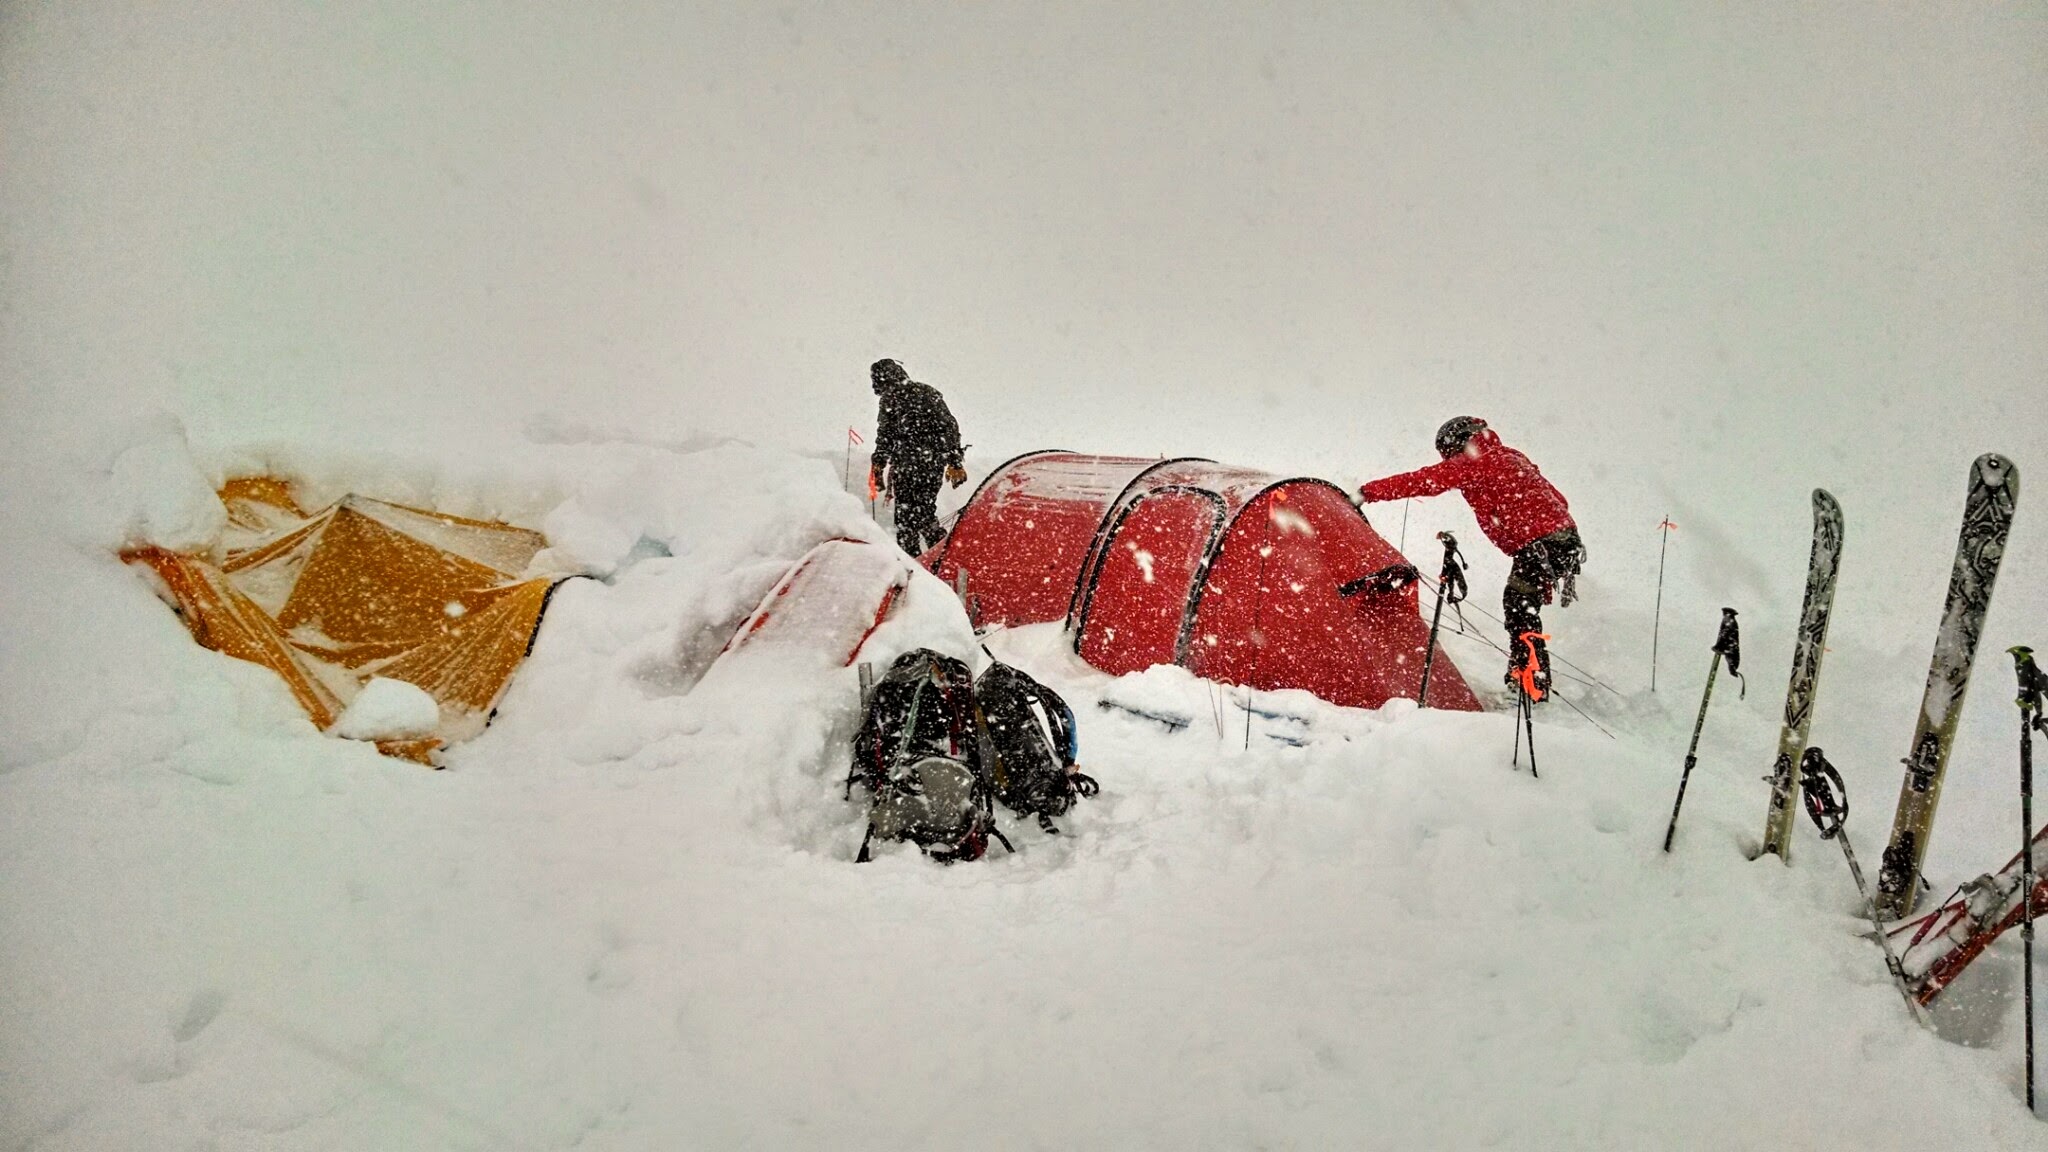
Fig. 5dm.2 - Snow storm at camp on the Pika Glacier, AK, USA. (Credit: West).
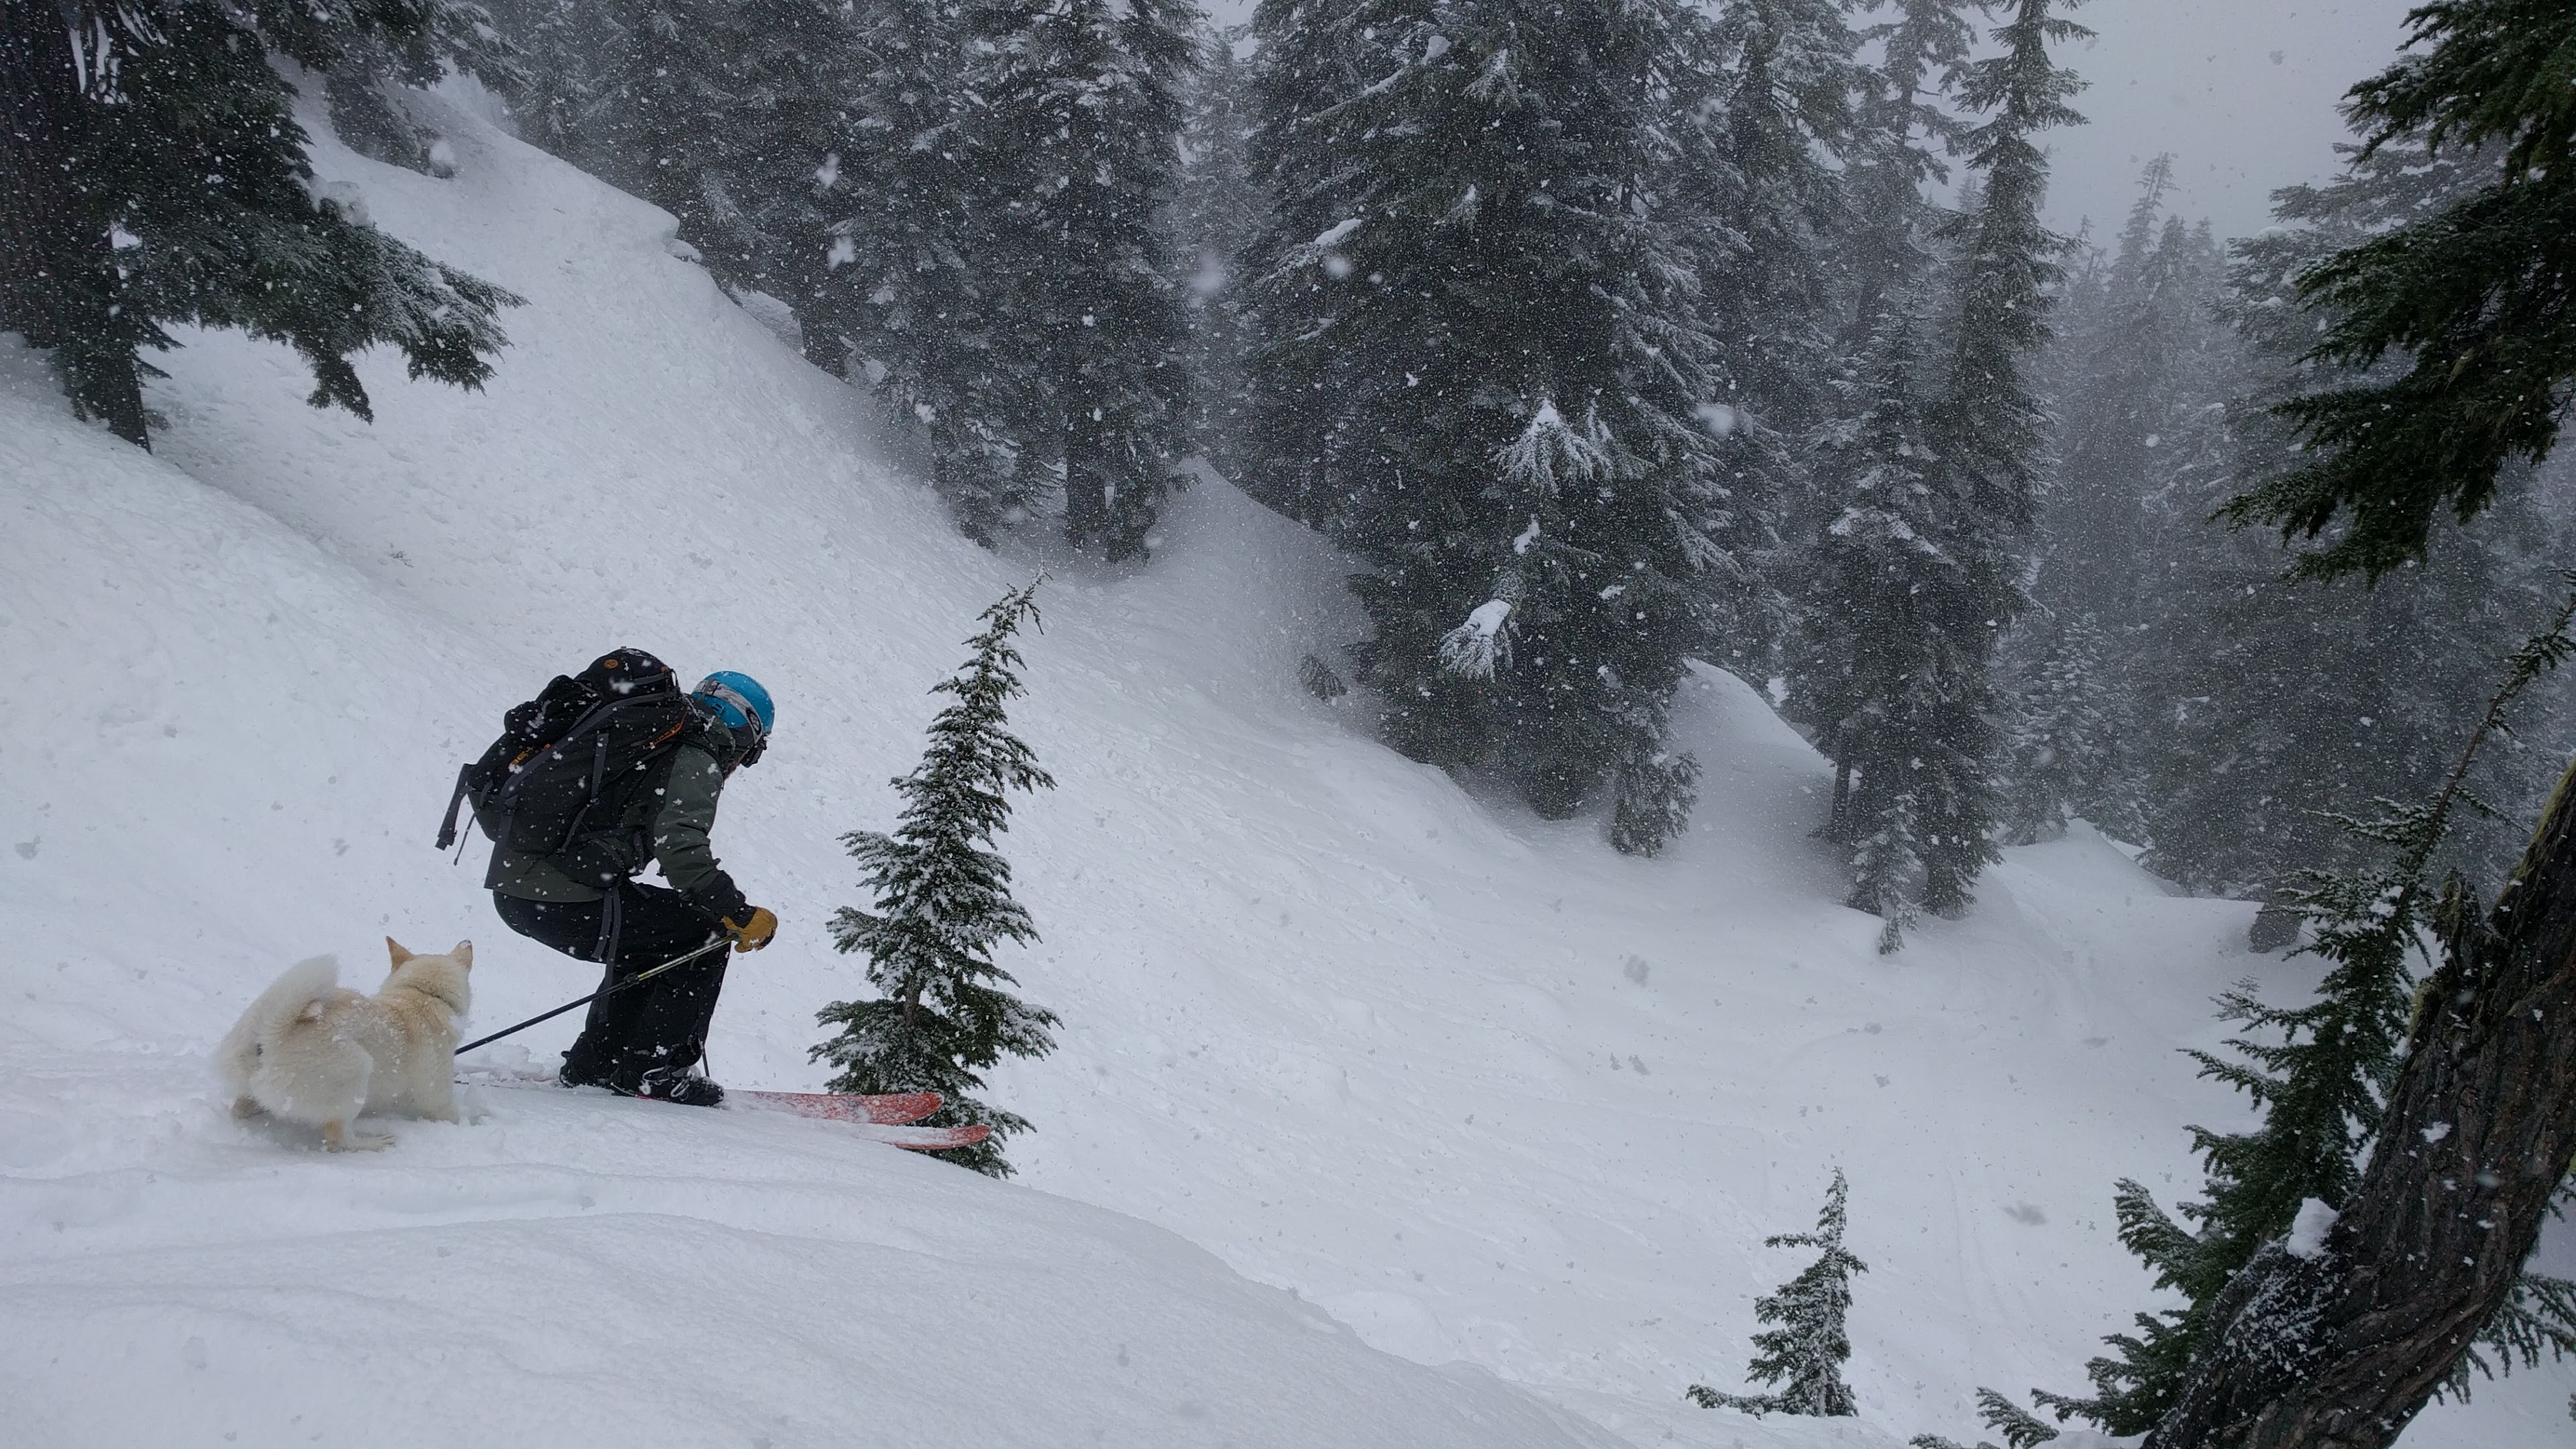
Fig. 5dm.5 - Storm skiing with the pup in wet snow associated with a low pressure system at Steven's Pass, WA, USA. (Credit: West)
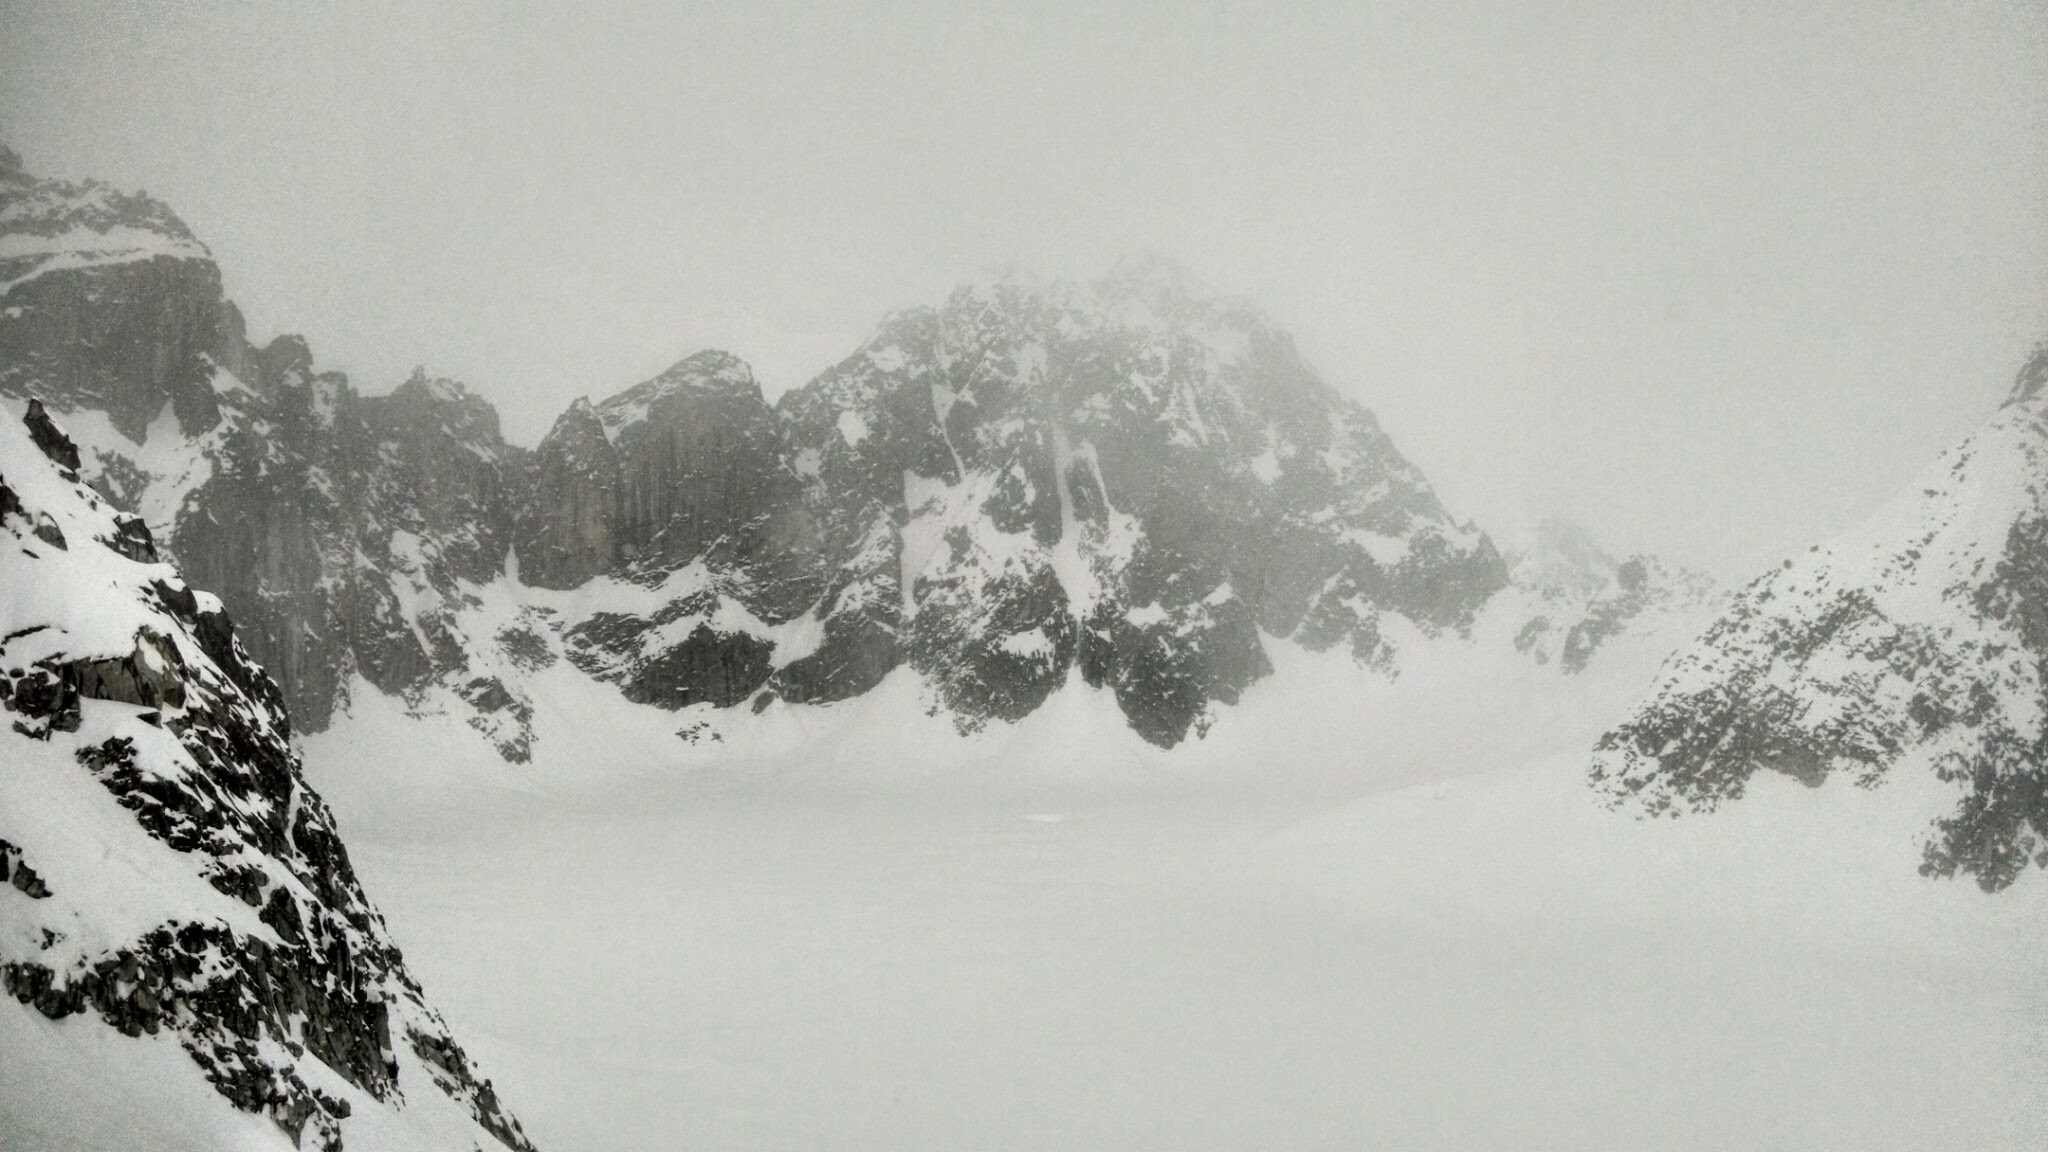
Fig. S3.6 - Storm clouds enshroud a cirque in the Alaska Range, AK, USA. (Credit: West)
Keywords: low pressure system, cyclones, surface low, isobars, converge, high pressure system
Figure Credits: Howard: Rosie Howard, West: Greg West, Stull: Roland Stull