The purpose of this learning goal is to enable you to identify likely areas of highs winds by using pattern recognition and weather maps.
The BC South Coast typically sees two types of low pressure systems that bring large-scale high winds. These notoriously bring widespread power outages and tree damage to lowland population centres. The fastest winds usually occur ahead, with, or following a front. However, these vigorous lows typically bring dangerous strong winds to the mountains as well (especially wind-exposed areas, see Learning Goal 6f). These are very hazardous to skiers both in and out of bounds.
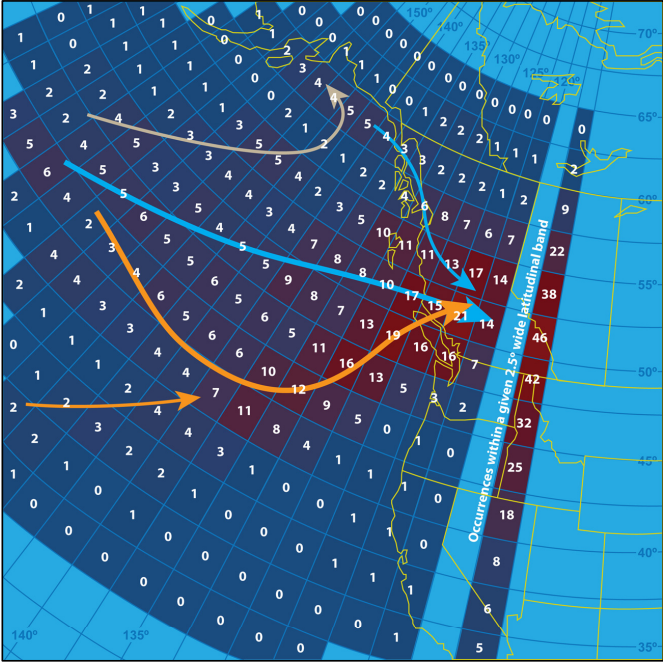
Fig. 5j.1 - Common tracks for low pressure systems that bring high winds to the South Coast. The most common tracks are shown with thicker arrows. For simplicity, ignore the numbers and shading. (Credit: Read)
Dr. Wolf Read, known locally as the "Storm King," did his PhD at UBC on BC South Coast wind storms. Thanks to his hard work, we know the characteristics of lows that produce large-scale high winds. They are most frequent in the first half of winter (Nov-Jan). Most approach from the southwest, producing strong southeasterly winds, while some approach from the west, producing strong westerly winds. Typically, the lows are deepening (i.e. their minimum pressure is lowering) as they approach the South Coast, reaching a minimum pressure of 99.4 kPa or lower. Lower minimum pressures typically mean a stronger pressure gradient that produces stronger winds. The optimal low-centre makes landfall near the northern tip of Vancouver Island (Fig. 5j.1).
Let's look at some real-world forecast maps for wind storms. Recall
that "wind-barb" symbols are expained in Learning Goal 5b.
Abbreviation used in the weather maps below include:
This is what a worst-case scenario looks like for a South Coast wind storm:
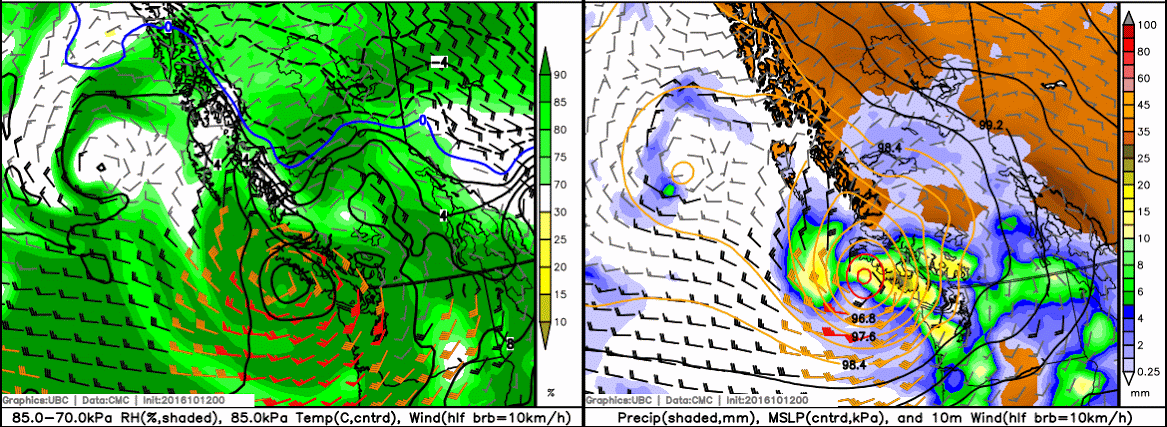
Fig. 5j.2 - Worst-case wind storm maps showing (left) wind barbs at 85.0 kPa and sea-level-pressure (SLP, contours), and (right) 10-m wind barbs and precipitation rate. (Credit: West)
Note that the central pressure is about 95.5 kPa (contours are every 0.4 kPa; a VERY deep low), there is a strong pressure gradient around the low and across the South Coast, indicated by the fact that the isobars are close together. The low is tracking towards northern Vancouver Island. This storm was also forecast to be deepening rapidly as it approached the coast. The 85.0 kPa winds are greater than 100 km/h, and even the 10 m winds are forecast to be greater than 60 km/h.
However, if you look closely, the wind speeds drop off very rapidly over land. Models misrepresent this, especially where the terrain height approaches the pressure-level height, as occurs at the over the Coast Mountains on the 85.0 kPa map. This is why it's important to judge the storm's strength as a whole, and look at upstream wind speeds over the ocean. The widespread nature of moderate-strong winds indicates that hazardous wind speeds are likely not confined to over-water areas. Rather, this is a large-scale area of high winds, and you're likely to see similar wind speeds at wind-exposed locations in the mountains (like ridgetops).
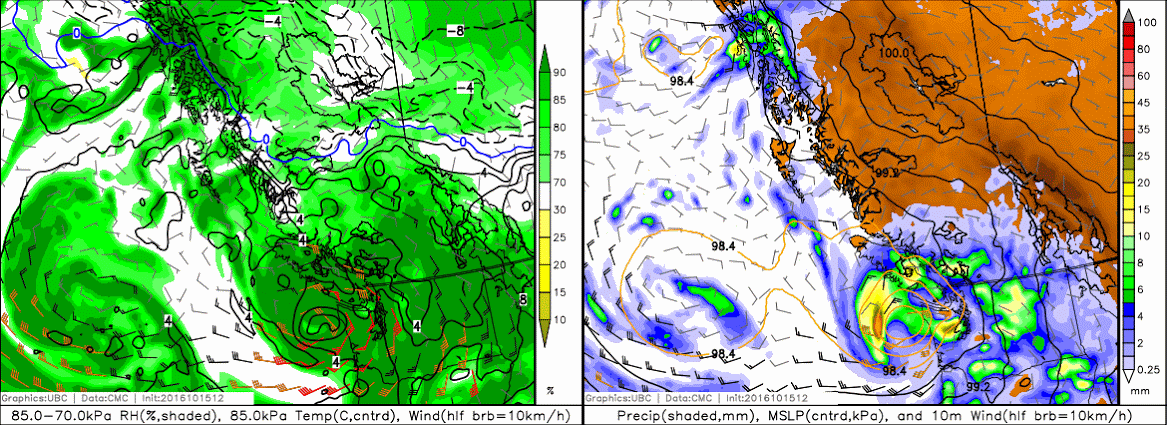
Fig. 5j.3 - As in Fig. 5j.2, but for a more typical strong South Coast wind storm. There are still a few wind barbs off the coast at 85.0 kPa that are greater than 100 km/h. (Credit: West)
Pressure-level maps that are a few hundred metres above most ridgelines give you a better indication of expected wind speeds in wind-exposed areas (i.e. free-atmosphere wind speeds). For many of the southern BC mountains, 70 kPa is a good level to look at (Fig. 5j.4).
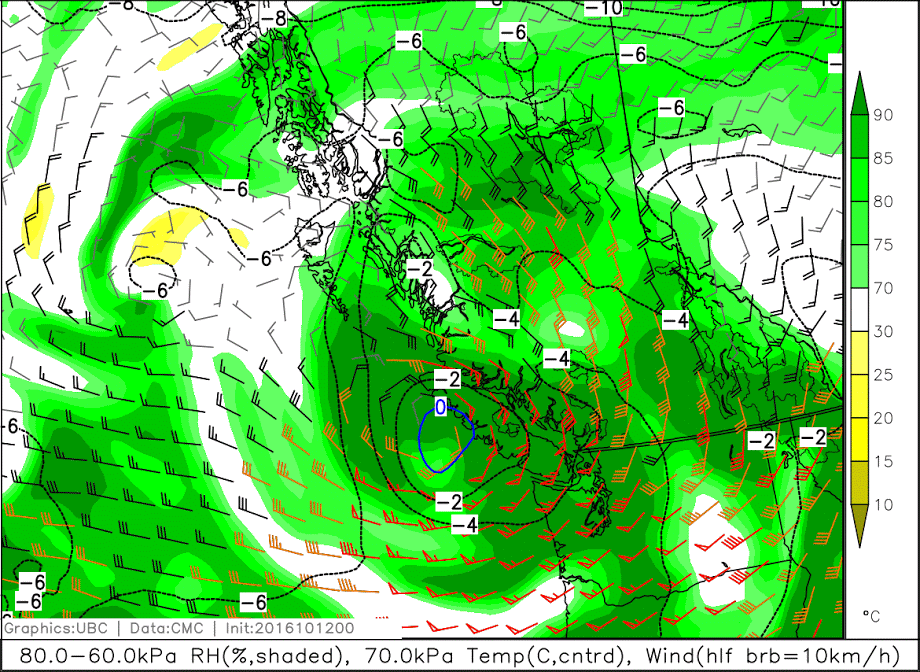
Fig. 5j.4 - A 70-kPa map for a worst-case wind storm at the South Coast. (Credit: West)
In Fig. 5j.4, the 70.0 kPa wind speeds over the Olympic Peninsula in northwest Washington are 130 km/h! This is an exceptional case. As a rule of thumb, 70.0 kPa winds greater than 60 km/h will bring high wind speeds to wind-exposed areas in the mountains of Southern BC.
Looking at surface (technically 10 m above the ground) wind speed maps can also give you a feel for the severity of the wind storm (Fig. 5j.5).
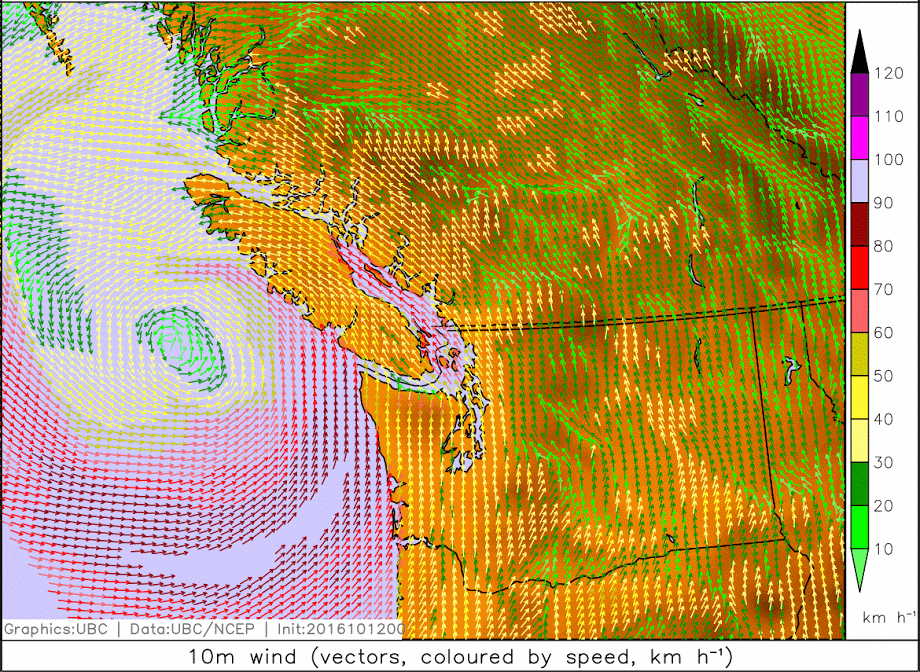
Fig. 5j.5 - Surface (10-m above ground) wind speeds for a major wind storm. (Credit: West)
Fig. 5j.5 is a surface wind map for a severe South Coast wind storm. Winds over much of the BC South Coast waters are 60-90 km/h. Even stronger winds are found off the Washington Coast. Surface winds over the water greater than 50 km/h nearby your intended mountain destination indicates strong winds are likely in wind-exposed areas of the mountains. Further, the widespread nature of the moderate-strong winds gives you the clue that high winds are likely not confined to the ocean. Instead, this is a large-scale area of high winds that will also give you trouble in the adjacent mountains.
As mentioned above, NWP model wind speeds drop off rapidly as you move inland. While this may be representative of wind-protected areas within the mountains, the displayed wind speeds are far slower than you would experience in wind-exposed areas. The purpose of this learning goal is to enable you to recognize large-scale areas of high winds, so that even if the model-forecast 10 m wind speeds over the mountains aren't strong (as in Fig. 5j.5 above), you'll know better (as advised in Learning Goal 6f).
Keywords: prefrontal, postfrontal, southeasterly, westerly
Figure Credits
Read: Wolf Read, 2015: The Climatology and Meteorology of
Windstorms That Affect Southwest British Columbia, Canada, and
Associated Tree-related Damage to the Power Distribution Grid. UBC PhD
dissertation.
Howard: Rosie Howard
West: Greg West
Stull: Roland Stull
COMET/UCAR: The source of this material is
the COMET® Website at
http://meted.ucar.edu/ of the University Corporation for Atmospheric
Research (UCAR), sponsored in part through cooperative agreement(s)
with the National Oceanic and Atmospheric Administration (NOAA), U.S.
Department of Commerce (DOC). ©1997-2016 University Corporation for
Atmospheric Research. All Rights Reserved.
NOAA: Images courtesy of NOAA/NWS, www.nws.noaa.gov
NASA: Images courtesy of NASA, www.nasa.gov
Google: Map data (c) 2016 Google