ATSC 113 Weather for Sailing, Flying & Snow Sports
Predicting areas of light winds
Learning Goal 5k. Use wind and pressure maps to predict areas of light/calm winds.
In this section you will learn how to identify large-scale light or calm winds conditions.
Weather patterns associated with light winds
You have already learned that high pressure is generally associated with fair weather (Learning Goals 5e and 5i). More specifically, high pressure is associated with light or calm winds (which we will just call light winds from now on). Using your ability to identify high pressure systems on weather maps will likewise allow you to identify regions of light winds. Light winds are most likely to be found near the center of high pressure systems. They are less guaranteed on the periphery.
A good rule of thumb is that when there is a weak pressure gradient the winds will be light. This is because pressure differences drive airflow. When those differences are small, air flow is weak. On a pressure map (Fig. 5k.1), the weaker the pressure gradient, the further apart the isobars will be.
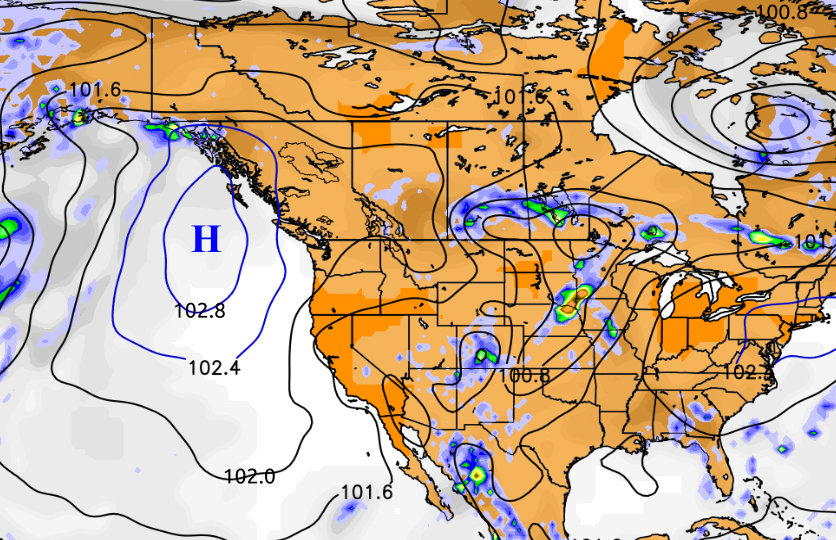
Fig. 5k.1 - Sea level pressure (black and blue contours) map of North America. High pressure is centred just off the BC coast in the Pacific Ocean. A weak pressure gradient, indicated by the isobars being far apart, leads to light winds over BC and its coastal waters. (Credit: West)
Occasionally, when a high pressure system is approaching the BC south coast from the west or northwest, and a low pressure system is departing to the east or southeast, this can set up a strong pressure gradient that can lead to more intense westerly or northwesterly winds. Another scenario where high pressure does not always lead to light winds for BC is when we get outflow winds, which is discussed in Learning Goal 6l.
Low-level wind maps
While pressure maps are helpful for indicating wind speed, your best resource for identifying areas of light winds is a low-level wind forecast map, e.g. at the surface or at the 85.0 kPa pressure level. These will generally show wind speed and direction with wind barbs (Learning Goal 5b), coloured vectors (arrows), or monocolour vectors with background colour contours indicating speed. Maps that show wind speed by colour are easiest to interpret by referring to the wind speed-colour scale (Fig. 5k.2).
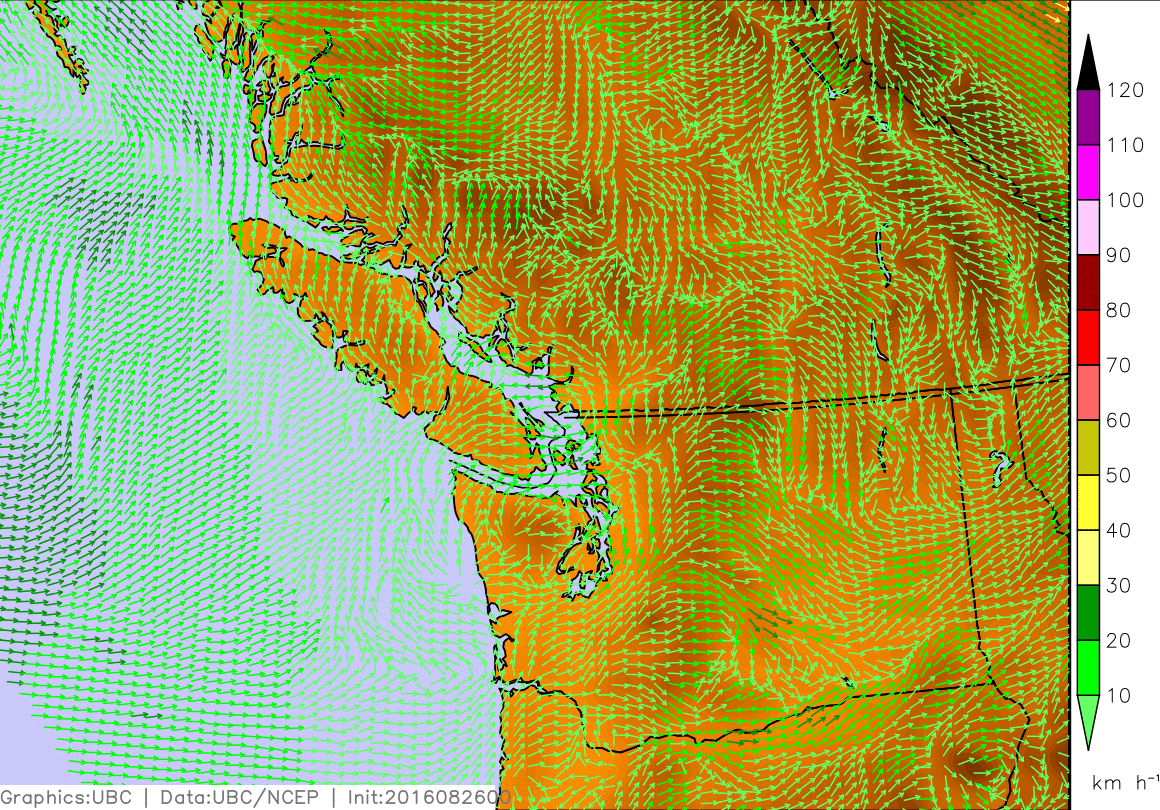
Fig. 5k.2 - An example of a surface wind map showing large-scale light winds in southern BC and Washington State. Wind speed is shown by the colour of the vectors according to the scale on the right of the map. Wind direction is also shown by the vectors, where they point towards the direction in which the wind is going. Winds over the entire land area are less than 20 km/h. (Credit: West)
CAVEAT: modelled surface winds are not perfect! Models often cannot simulate many details of the wind structure, or correctly account for the friction from the ground. If you start using these maps regularly, and comparing them with the winds you actually experienced while skiing in a particular area, you will develop a feel for what the modelled wind speeds correlate to in the real world.
What hazards do light winds present to skiers?
None, really. For now, know that large areas of light winds are ideal for recreating in the mountains! It makes everything from chairlift rides, to ridgetop traverses, to lunch on the patio more pleasant (Fig. 5k.3).
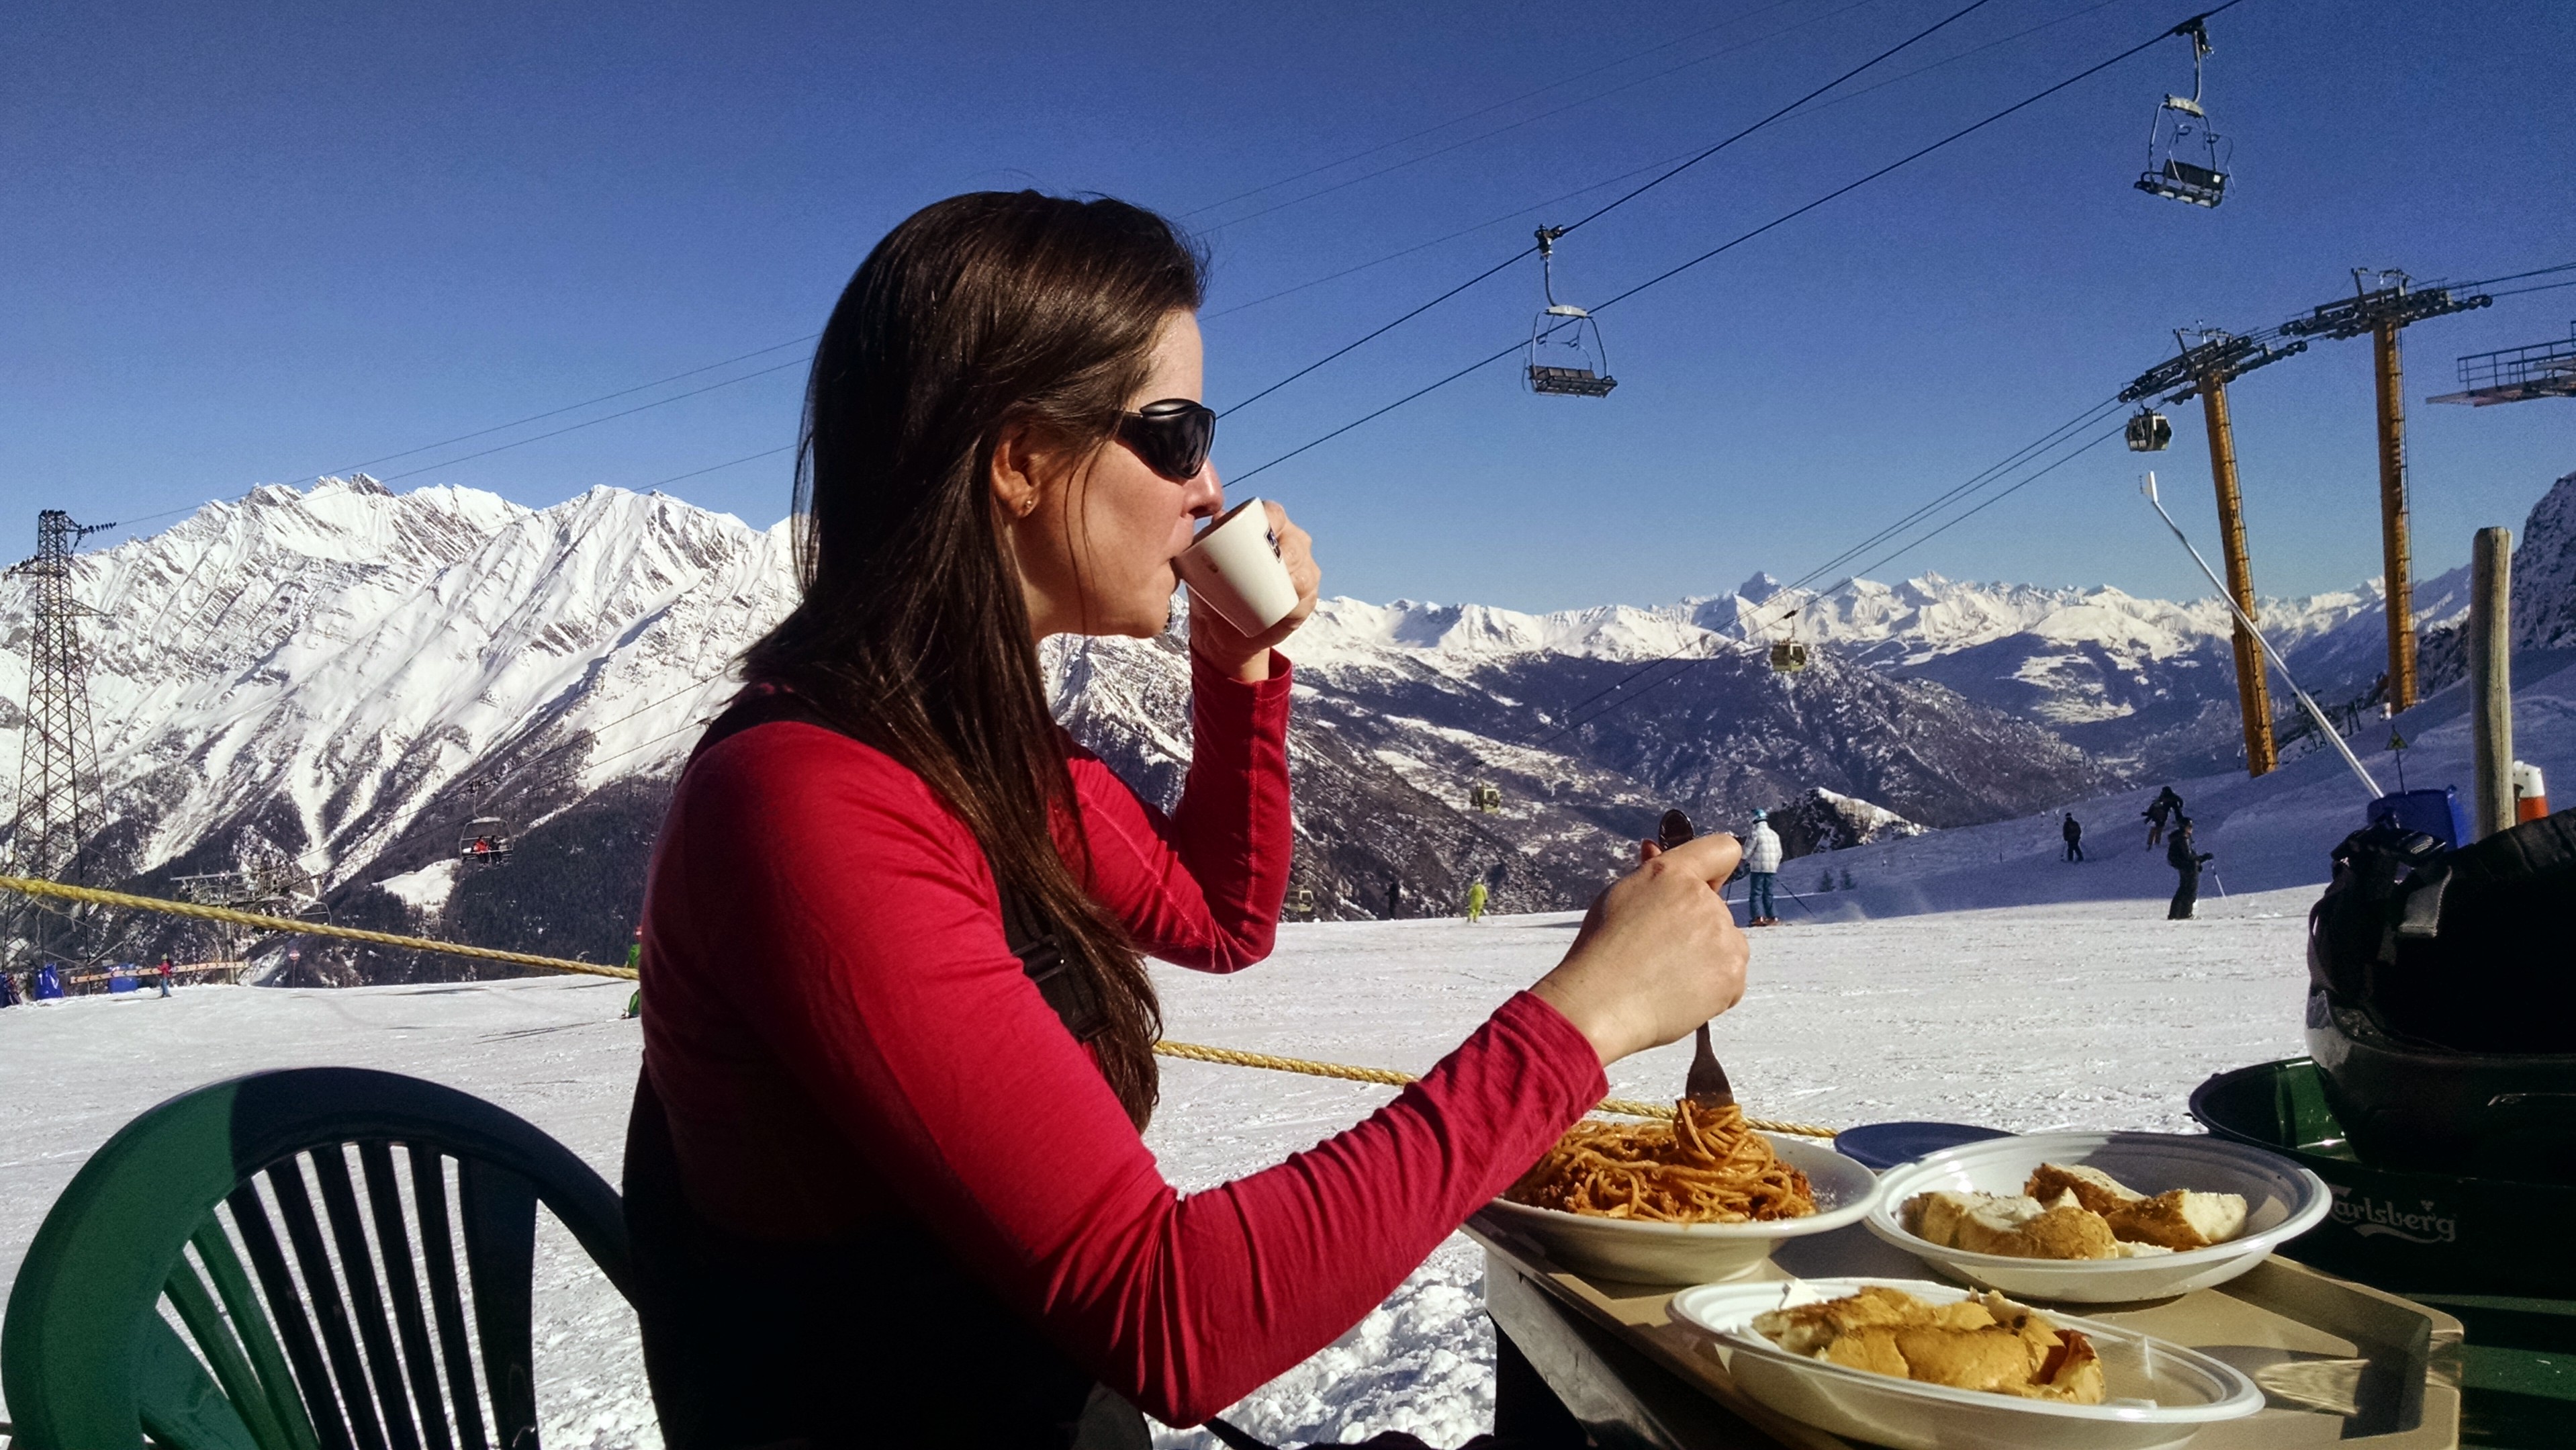
Fig. 5k.3 - Doing as the Italians do, sipping espresso and twirling pasta in the Italian Alps on a beautiful high pressure day with calm winds. (Credit: West)
Key words: pressure gradient, outflow winds, wind barbs, vectors
Figure Credits: Stull: Roland Stull, West: Greg West, Howard: Rosie Howard