 |
Roland Stull
UBC
The intensity of the return signal (radar echo) received by the radar depends not only on the intensity of the rain, but also on the distance of the rain from the radar, the shape of the hydrometers, and the sensitivity of the radar antenna and electronics. Rain that is further away returns a weaker signal than rain close by.
The radar software automatically computes a range-corrected and equipment-calibrated measure of reflectivity, which is given the symbol Z. But Z can vary from extremely large values for heavy rain, to very small values for mist. To make this wide range of Z accessible and viewable on computer screens, the software first takes the logarithm of Z, which is expressed in units of decibels (dB). Hence, the numbers that are usually displayed on reflectivity radar images are in units of dBZ.
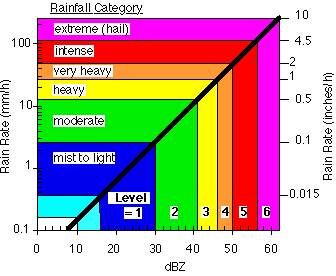
Larger values of dBZ correspond to heavier rain from more intense thunderstorms, while small values correspond to light rain from shallow clouds, or returns from bugs. Rainfall rate (RR) is defined as the rate of increase of depth of water in a rainguage, measured in mm/hour. An approximate relationship between dBZ, RR, and descriptive intensity is given in Fig H1. To use this figure, start with the value of dBZ measured by radar, find that value at the bottom of the figure, then go straight up in the figure to you hit the diagonal line, and finally move horizontally straight to the left to read the RR along the left axis. For example, a radar reflectivity of 40 dBZ corresponds to an approximate rainfall rate of RR = 10 mm/h, which is a moderate rainfall rate.
|
|
Fig H1. Rainfall intensity chart, for radar reflectivity returns in units of dBZ. (from Stull, 2000: "Meteorology for Scientists and Engineers, 2nd Ed., Brooks/Cole Thomson Learning. 502 pp.)
The colours that are used to represent different echo strengths are arbitrary -- different weather web sites use different colours. Most weather web sites give the colour scale vs. dBZ along with the picture of the radar echo, so be sure to look at the scale before you try to interpret the radar image. In the reflectivity image below (Fig H2) for US National Weather Service radar at Little Rock, Arkansas (station KLZK), the dBZ colour scale is along the left side.
In this particular image, the radar is in the center of the image. The thin white lines show state boundaries, with Arkansas in the center, and the thin green lines show county boundaries. Major roads (interstate highways) are shown as thin red lines, and some lakes are outlined in white. Major towns are also identified.
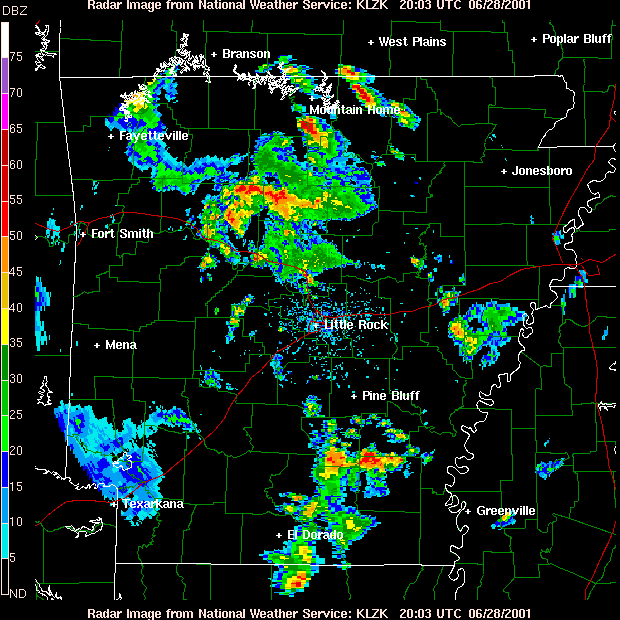 |
Fig H2. Radar reflectivity image from the radar at Little Rock, Arkansas.
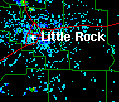
Near the center of the display, ground clutter is shown as the tiny dots of blue (see Fig H3a.) South of El Dorado is one thunderstorm cell (Fig H3b). A cell is a small region of intense rain, which shows up as concentric rings of colour, going from the colours for weakest rain at the outside to stronger rain at the center of the cell. This particular thunderstorm cell has a peak reflectivity of roughly 52 dBZ, which corresponds to "intense" rain from the info in Fig H1.
 |
 |
|
(a)
|
(b)
|
Fig H3. (a) Ground clutter near the Little Rock radar, and (b) a thunderstorm cell south of El Dorado.
Sometimes one massive thunderstorm cloud (as viewed by eye) will contain more than one thunderstorm rain cell (as viewed by radar). In fact, we see that the cell south of El Dorado is part of a multicell thunderstorm that contains about 5 cells of different intensities (shown in Fig H4 by the 5 circled regions of relatively high reflectivity). Cells can have a wide range of sizes, and one can see that the circle just north of El Dorado in Fig H4 actually contains 3 smaller cells.
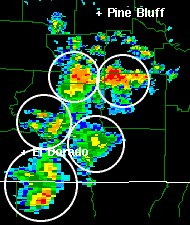 |
Fig H4. Multicell thunderstorm between El Dorado and Pine Bluff, where the individual cells are circled.
Sometimes the thunderstorm cells become organized into a line, called a squall line. North of Little Rock are a number of squall lines imbedded in a large area of thunderstorms (Fig H5). Within the region are drawn 3 boxes to identify some of the squall lines, with the bottom one being the most intense. Squall lines can be aligned in any direction, or can be curved or bowed.
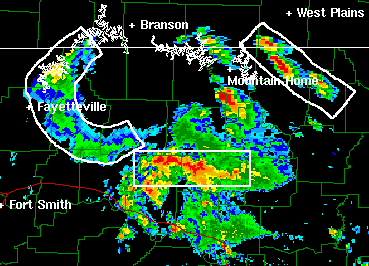 |
Fig H5. Squall-line thunderstorms (outlined with white boxes), within a Mesoscale Convective System (MCS) filling the whole figure.
Classic-looking squall lines are like the one shown below in Pennsylvania (Fig H5.5). See other good examples in Florida , Michigan , and Indiana .
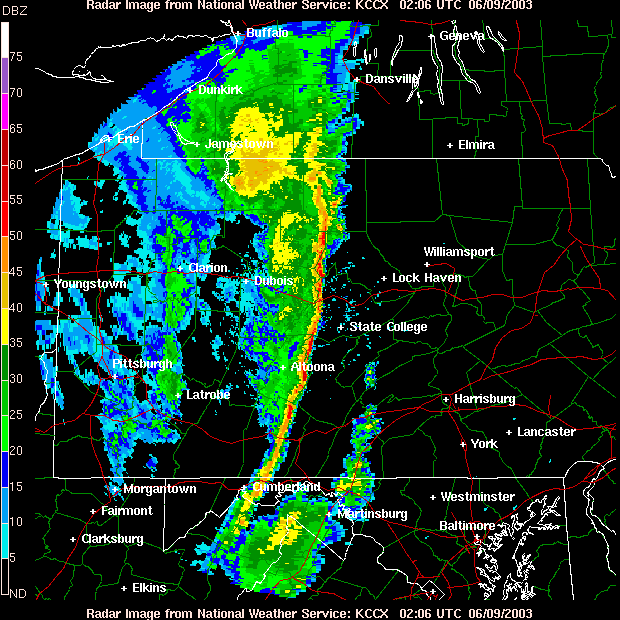
Fig H5.5. Squall-line thunderstorms (visible as the thin curved line of orange and red in this radar reflectivity image) in Pennsylvania, in June 2003.
Individual thunderstorm cells of heavy rain, possible hail, strong winds, and sometimes tornadoes, often are blown toward the northeast by the prevailing winds in the middle of the troposphere (roughly 5 -7 km above ground). However, sometimes the northern most cells in a squall line will die out because they are further away from the fuel supply of warm moist boundary layer air flowing in from the southeast. Also, often new thunderstorm cells will be triggered along the southern end of a squall line, because of the abundance of fuel there. The net result is that the whole squall line might move in a direction that is different than the movement of the individual cells. This is illustrated in Fig H6, where the squall line movement toward the east is shown by the two rectangles, and the movement of individual cells toward the northeast is shown by the circles and arrows.
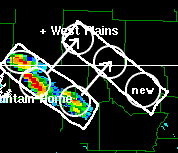 |
Fig H6. Movement of a squall line (rectangles) and of individual thunderstorm cells (circles). In this illustration, the line is moving toward the east, while the individual cells are moving toward the northeast.
Sometimes the thunderstorm-line develops a curved or bowed shape, and is called a bow echo. This can occur when strong horizontal winds from the top of the troposphere descend to mid-troposphere heights, where they hit the back of the squall line and push it forward faster than the ends. The ends of this bow echo sometimes develp a curved shape. Such a bow echo swept into Wisconsin during the night of Aug 13-14, as seen by the radar reflectivity(pdf), the Doppler base velocity(pdf), and the storm-relative velocity (pdf) images.
Many sources of radar data on the web allow images to be animated or looped, which clearly shows cell and line movement. Another source of cell movement information is via Radar Summary Charts, which show radar reflectivity, rain cell top altitude, direction and speed of cell movement, and whether hail, mesocyclones, or tornadoes are detected. An example is shown in Fig H7, where cell movement direction is indicated with the arrows, and speed in knots is written near the tip of each arrow. From each major cell is drawn a horizontal line, one end of which touches the cell to identify it. Written on this line is the rain-echo top altitude in hundreds of feet, and any additional information such as if hail is suspected. For example, the cell near the top center of this figure is moving toward the northeast at 7 knots, has a echo top at 45,000 feet (13.7 km), and is suspected of containing hail.
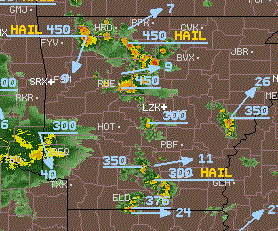 |
Fig H7. Radar Summary Chart for Arkansas, for a time roughly 1.25 hours earlier than the other figures in this section. (This figure extracted from an image copyright by WSI Corp that was served by http://www.intellicast.com/, using data from the US National Weather Service)
Exceptionally large values of reflectivity (dBZ > 60) are often caused by hail in thunderstorms. An example of a hail storm in west central Texas just west of the city of San Angelo is shown below, where the magenta colors indicate dBZ >= 65, and the white colors indicate dBZ >= 75.
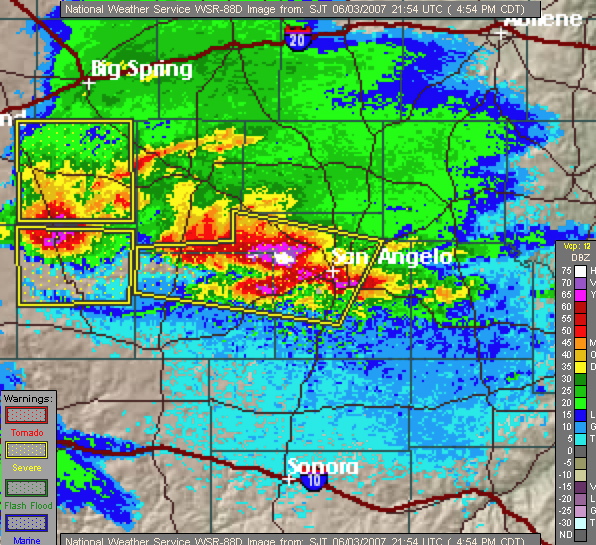
Fig H7.5. Radar reflectivity on 3 June 2007, from the US National Weather Service radar at San Angelo (SJT) Texas.
Broad regions of low radar reflectivity indicate widespread drizzle from stratiform clouds. These often form in advance of warm fronts and north of low pressure centers. (This differs from thunderstorms, which often form along cold fronts.) An example of a region of light rain from probably stratiform clouds is shown in Fig H8, near Texarkana in the southwestern portion of Arkansas. Note the smoothly curved lower-left edge of this reflectivity area. This is not the actual cloud edge, but just the limit of range that is visible from the Little Rock radar. So the widespread area of drizzle probably spreads further southwest, even though we can't see it from this one radar. Widespread regions of stratiform clouds and drizzle or snow are more common in winter over N. America.
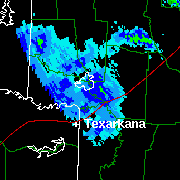 |
Fig H8. Large region of drizzle and light rain, probably falling from a deck of nimbostratus clouds. These are not thunderstorms.
When the radar reflectivity data is viewed as a vertical slice through the storm [namely, as a Range-Height Indicator (RHI) display] the result is as shown in Fig H9. In this figure, range (along the bottom axis) is in units of nautical miles, and height (along the vertical axis) is in units of thousands of feet. Thus, the vertical scale is greatly stretched compared to the horizontal scale. Namely, the vertical distance between each grid line is about 1.2 nautical miles, while the horizontal distance between tic marks is 5 nautical miles.
In this figure, orange and red colours indicate the heaviest precipitation. The tan region just above the ground is below the lowest radar scan; namely, there is no data there. So there might be heavy precipitation there under the storm even though it was not scanned.
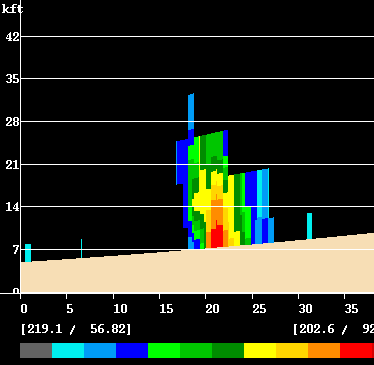 |
Fig H9. RHI scan through a thunderstorm, showing reflectivity.
Remember that the radar see through the storm to see what is happening inside. If the same storm was viewed with the naked eye, the result might look as sketched in Fig H10. Namely, this particular RHI display is set up to show only the moderate to heavy rain, and does not show the small cloud droplets and ice crystals that make up the rest of the cloud that we would have seen by eye.
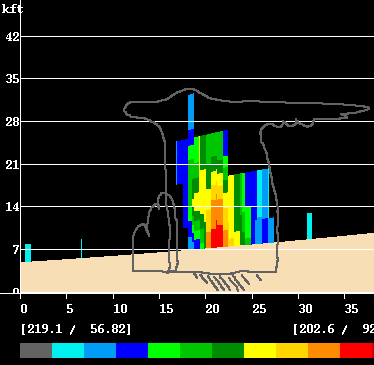 |
Fig H10. Sketch of thunderstorm outline as might have been viewed by eye.
Hurricanes consist of spiral bands of thunderstorms that converge into an intense ring of thunderstorms called the eye wall, just outside of the clear eye of the storm. While hurricanes are over the deep ocean, they are out of range of land-based radars. However, when they get close to land, coastal radars can pick up the storm. Fig H11 shows the radar reflectivity of hurricane Erin as it struck southern Florida in 1995.
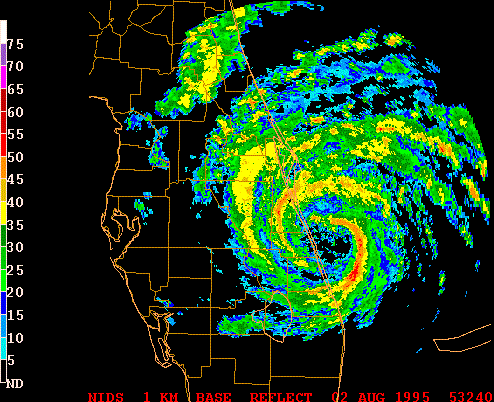 |
Fig H11. Radar image of Hurricane Erin as it strikes southern Florida in August 1995.
In much of western North America, high mountains block the radar beam in certain directions. Also, at other locations there are building or other structures that block some of the beam. The figures below, produced by CIMMS, shows the portions of the USA that are covered by one or more WSR-88D radars, for a beam elevation angle of 0.5 degrees. In Canada, most of the country is not covered by Doppler radar, and those few radars in western Canada also suffer from extensive blockage.
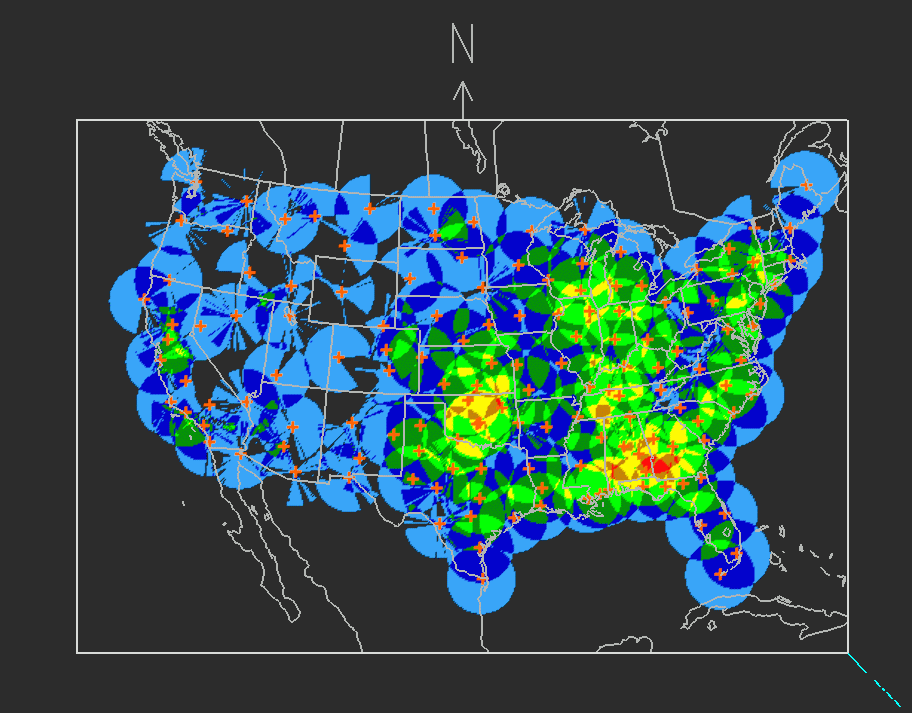
Fig. H12. Radar blockage over contiguous USA. Coverage by one radar is light blue, coverage by two is dark blue, 3 dark green, 4 light green, 5 yellow, 6 brown, 7 red. No coverage (i.e., blockage) is colored black.
.
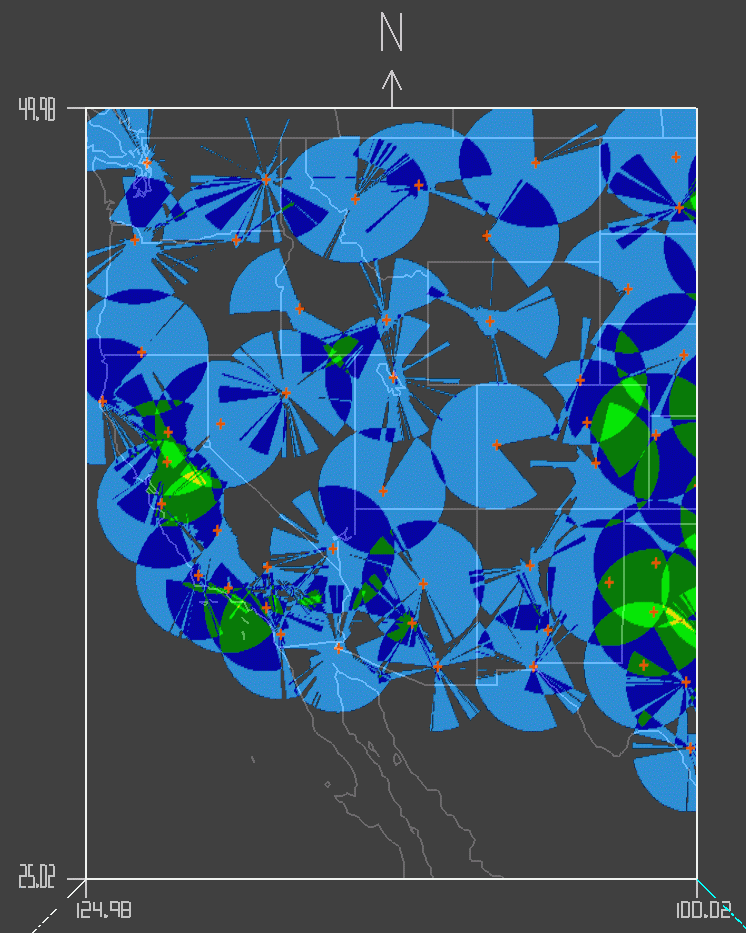
Fig. H13. Radar blockage over western USA.
For live USA images and loops, do a web search on:
For live Canadian images and loops, do a web search on:
For web-based tutorials on weather radar:
.
revised by R. Stull, Sep 2010
Copyright © 2010 by Roland Stull
.