Filtering
The professional geophysicist has a wide range of mathematical techniques for adjusting the appearance of data so that the various contributing factors can be either enhanced or suppressed. This does NOT mean that information is "added" to data sets. It means that aspects WITHIN the data are emphasized or reduced. Three examples with before-and-after images are shown:
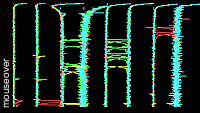
Reduce noise: The eight line-graphs of data shown here include spiky noise on top of the useful, more smoothly varying information. Mouseover on the figure shows the result of spike removal and smoothing. |
 |
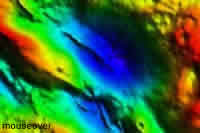
Emphasize (or de-emphasize) features: Calculations can be applied to generate a derived image from measured data. This image shows a map of gravity data that is roughly 300km by 180km. Mouseover reveals a "total horizontal derivative" who's goal is to emphasize edges of buried density anomalies. |
 |
Remove unwanted signals: Sometimes the effects of features not related to the problem must be removed. Here is a magnetic data set gathered near a building. Mouseover shows the result of removing the overwhelming effect of that building so that slight variations related to buried utilities can be more easily seen. |
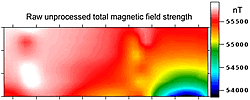 |
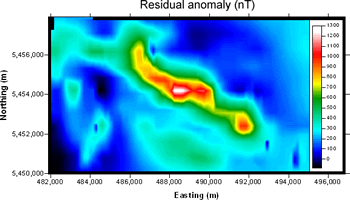
Upward continuation: The example data set we have been using (below left) has not had any filtering applied. One processing step that might be applied is to recalculate data so they appear as if they had been gathered at a higher elevation - in this case with the sensor at 1800 feet instead of 1000 feet. Two reasons thims might be done are (a) if small scale features were to be reduced in favour of larger features, or (b) to match adjacent data sets that had been gathered at different times or by different contractors.
 |
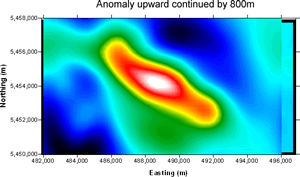 |
Raw, unprocessed data. |
Upward continued to 1800m. |