|
Resistivity and IP over the McDermott Deposit |
Reference, location and geologyData for this example were extracted from Hallof and Yamashita, 1990, page 227(1). Resistivity and IP pseudosections are presented from the book, followed by results of inverting these data with the UBC-GIF DCIP2D code. The location of the survey is near Matheson, Ontario, Canada. Geology can be summarized as follows:
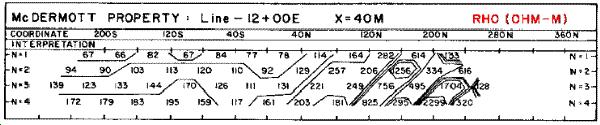
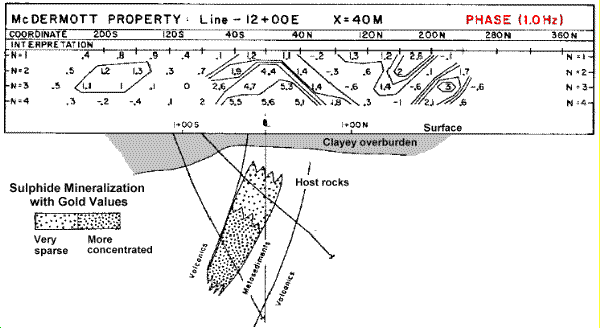
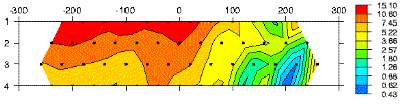
The survey involved a conventional dipole-dipole array using a = 40 metres, and n = 1 to 4. Phase IP data were gathered with the resistivity information. Original survey resultsData were gathered along a set of parallel lines, but only results gathered along line 1200E are presented here. Raw data were presented in pseudosection contour plots and interpreted directly. Resistivity and chargeability (phase data gathered at 1.0 Hertz) pseudosections are shown here, with the geologic cross-section interpreted from borehole logs presented under the data. The chargeable sulphide mineralization is clearly evident but these plots do not provide quantititative information about depth to top, depth extent, or size and shape of the target rocks. The resistivity pseudosection suggests that overburden is relatively conductive, and that underlying rocks are generally of at least two types - moderately conductive to the left of station 40N, and moderately resistive to the right.
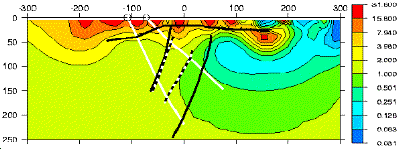
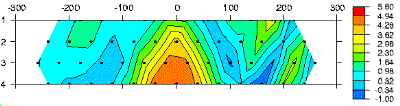
DC resistivity inversion resultsConductivity structure recovered by inversion shows surface features, and suggestions of lateral extent of overburden. However, overburden thickness cannot be accurately estimated.
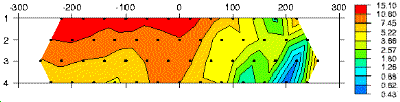
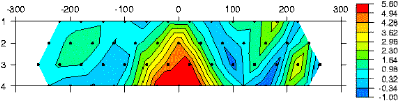
IP inversion resultsChargeability structure is recovered by inversion of IP data. There is clearly a chargeable high associated with the sulphide mineralization.
(1) Fink, J.B. ... (et al.) editors, 1990, Induced Polarization: applications and case histories. Society of Exploration |