| |
 GPR is the only common geophysical survey that responds to subsurface changes in dielectric properties as well as changes in conductivity. At industrial sites, both physical properties might be expected to vary across the water table, in regions of oil contamination, and where fill materials are variable. GPR responds by reflecting or scattering off boundaries where these physical properties change. The velocity of signals in the ground is determined mainly by dielectric permittivity, and velocity is necessary for converting echo travel times into distance to the reflector. The attenuation of GPR signals is affected primarily by conductivity, so variations in penetration depth should provide some information about the various regions of materials. GPR is the only common geophysical survey that responds to subsurface changes in dielectric properties as well as changes in conductivity. At industrial sites, both physical properties might be expected to vary across the water table, in regions of oil contamination, and where fill materials are variable. GPR responds by reflecting or scattering off boundaries where these physical properties change. The velocity of signals in the ground is determined mainly by dielectric permittivity, and velocity is necessary for converting echo travel times into distance to the reflector. The attenuation of GPR signals is affected primarily by conductivity, so variations in penetration depth should provide some information about the various regions of materials. GPR can be referred to as radio echo sounding. The seismic analogy is often helpful:
- Surveying involves injecting a short pulse of energy into the ground and recording echoes.
- The GPR source energy is electromagnetic; therefore, relevant physical properties, namely conductivity and dielectric permittivity, are electrical.
- Results are usually presented similarly to seismic data, as position versus 2-way travel time.
- Wiggle trace presentation is shown below right. Amplitude of the trace represents voltage on the antenna, and echoes appear as "wiggles", indicating that radio energy that was emitted from the source antenna has echoed from some interface. More commonly the traces have one half the trace filled in (the variable area style of plot).
GPR concept involving "common offset" instrument configuration. Echoes arrive from targets that are within range of signals. The signals echo off surfaces that are perpendicular to the signals' direction of travel.
|
Radar section resulting from the survey shown to the left.
|
Data are commonly presented as echograms along a survey line with line position along the horizontal axis and two-way signal travel time along the vertical axis. Gray- or colour-scale images are also common, in which the colour is scaled to signal amplitude. In order to convert the signal's travel time to depth, a velocity for the signals in the grond is needed. Velocity is dependent mainly upon dielectric permittivity, although this approximation fails in very conductive soils. If the velocity (i.e. the ground's permittivity) cannot be estimated , it is advisable to try and measure the velocity using a particular field configuration called a common mid-point (CMP) or wide angle reflection & refraction (WARR). A table of velocities and attenuation rates from the instrument manual is given below.
| Material |
Velocity (m/ns) |
Attenuation dB/m |
| Air |
0.3 |
0 |
| Ice |
0.16-0.17 |
0.01 |
| Dry Soil |
0.15 |
|
| Dry Sand |
0.15 |
0.01 |
| Granite |
0.13 |
0.01 - 1.0 |
| Dry Salt |
0.13 |
0.01 - 1.0 |
| Dry Rock |
0.12 |
|
| Limestone |
0.12 |
0.4 - 1.0 |
| Wet Rock |
0.1 |
|
| Concrete |
0.08 - 0.12 |
|
| Pavement |
0.1 |
|
| Shales |
0.09 |
1 - 100 |
| Silts |
0.07 |
1 - 100 |
| Wet Soil |
0.06 |
|
| Wet Sand |
0.06 |
0.03 - 0.3 |
| Clays |
0.06 |
1 - 300 |
| Fresh Water |
0.033 |
0.1 |
| Sea Water |
0.033 |
1000 |
|
|
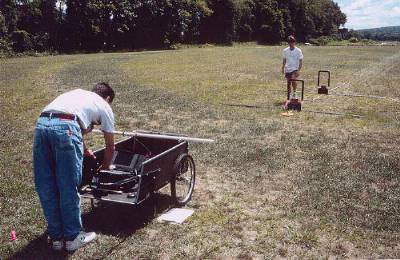 |
Ground penetrating radar survey data are most easily interpreted when measurement stations are very close together. In fact, if target interfaces dip by more than a few degrees, they may be invisible if station spacing is too coarse. One other important survey design consideration is the choice of antenna, which determines the centre frequency of signals, and hence the penetration depth and vertical resolution. If several antennas are available, it is a good idea to survey a short line with as many different frequencies as possible to establish the optimum antenna for the job. The figure above shows the instrument's operating console and laptop computer in a cart with the transmitter and receiver antennas arranged in a common offset configuration behind. The three components are linked with fiber optic cables.
|
|
