People who have decided to spend their lives trying to find answers to this kinds of questions are called Physical Oceanographers. Basically, we try to understand why water goes from one place to another and how this happens. And not just water, but also the things that are in it - salt, heat, pollutants.
These questions aren't academic either. What if instead of a bottle we had an oil spill? Or a sewage outflow? We catch fish in the ocean - where does their food come from? What happens if a storm blows, or temperatures rise? Is the answer different in summer than in winter? Understanding the physics of the ocean is a vital first step in understanding everything else about the ocean - and here in Canada we have a lot of ocean around us!
Knowing how the ocean works doesn't just stop at the water's surface.
The ocean and the atmosphere work together to produce our climate, and
there are many similarities in the physics that control both systems. There
is a lot of overlap between oceanography and atmospheric science.
Practically speaking, there are 4 basic ways in which we approach the problem of understanding the ocean:
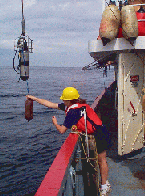
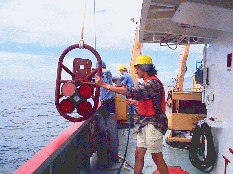
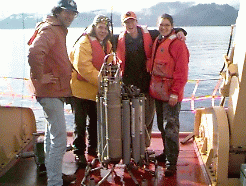
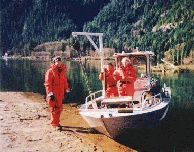
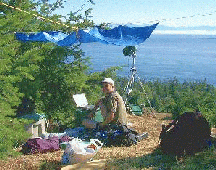
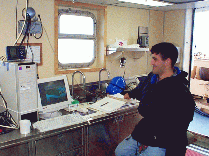
Oceanographers go to sea - from wading out into the surf to long cruises
on large ships, from deploying instrumented moorings to gathering data
directly by lowering measurement devices from a ship (as shown in the figure)
to using orbiting satellites. The ocean is so complicated that field measurements
are and probably always will be needed (and its always useful to remind
oneself what a vast and mysterious place the ocean is). Just think - over
most of the world, the oceans are 4 kilometers deep - and yet we can only
see into it a few meters! What goes on down there?
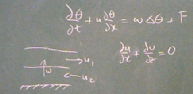 The mathematical
laws governing the behaviour of fluids were discovered centuries ago -
and yet the dynamics of fluids are so complicated that we are still chipping
away at the edges of knowledge. Theorists try to extract the essential
physical processes for a particular phenomenon, boiling down a complex
patch of ocean into as simple a set of equations as possible in order to
better understand them. For example, what controls the currents in Vancouver
Harbour? Is heating important? Tidal forcing? Turbulence? Energy constraints?
And if so, what then?
The mathematical
laws governing the behaviour of fluids were discovered centuries ago -
and yet the dynamics of fluids are so complicated that we are still chipping
away at the edges of knowledge. Theorists try to extract the essential
physical processes for a particular phenomenon, boiling down a complex
patch of ocean into as simple a set of equations as possible in order to
better understand them. For example, what controls the currents in Vancouver
Harbour? Is heating important? Tidal forcing? Turbulence? Energy constraints?
And if so, what then?
At some point we have to find out if the math we have written down really
matches what we see in the ocean. Numerical models, ranging from simple
simulations that can be performed in seconds on a PC to complex computer
runs lasting days on powerful workstations are a vital tool in connecting
what we think we know to what we see. Numerical models are also powerful
ways of playing "what if?". What if the temperature changed here? What
if a storm blew here?
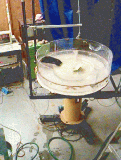
Sometimes things are just too complicated for a even a large numerical
model. Laboratory simulations are a way of exploring aspects of fluid flow
that we just don't have a good theory for (yet). How can water flow over
a ridge or through a strait? Does the rotation of the earth make a difference?
The picture at right shows a rotating table used to study these questions.
Flow patterns are determined by tracking small particles in video recordings.
Several projects fall into the area of "Estuarine Dynamics". An estuary is a region in which fresh water (from rivers) comes into contact with and is modified by seawater. Freshwater runoff is driven by summer warming, but the effects of fresh water can magnify in coastal regions to produce large currents. Steve Pond has been interested for many years in the wonderfully strange dynamics of the deep fjords on this coast. Rich Pawlowicz is making a study of how the complicated flows in the Gulf Islands control the circulation of the whole West Coast.
Vancouver Harbour is a relatively shallow channel between the Strait
of Georgia and the deep fjord of Indian Arm. A series of field programs
are being carried out to better understand the answers to questions like:
how does the deep water get renewed in Indian Arm? What is the effect of
First and Second Narrows on the estuarine flow here?

Ocean waters in the area between Vancouver Island and the mainland are characterized by an outflowing surface layer which is relatively fresh and warm (in the summer), and a colder, saltier, deep inflow. The upper panel shows the location of Temperature/Salinity data taken in the summer of 1998. The lower panel shows the correlations between temperature and salinity for water parcels at all stations, colour coded to the locations shown. Note the slope of the correlation, which is steeper for the blue and black data (near the Pacific Ocean end of the Strait of Juan de Fuca) compared with that for the red curves (off Vancouver). By understanding the reasons behind this structure, we can make estimates of how much water flows in each layer, and how much water gets mixed between the layers.
A little further out into the ocean, Susan Allen is interested in how deep ocean water upwells onto the continental shelf in summer, and Lionel Pandolfo has been involved in efforts to understand the longterm winds offshore and their effects on weather and coastal ecology.
 The
Strait of Juan de Fuca opens into a deep canyon that cuts across the continental
shelf. This provides a path by which deep Pacific water can upwell, or
move into shallower near-coastal areas, bringing nutrients with it. But
how does this happen? What is the difference between canyons that cut the
shelf (like Juan de Fuca) and those that don't (like Barkley Canyon)?
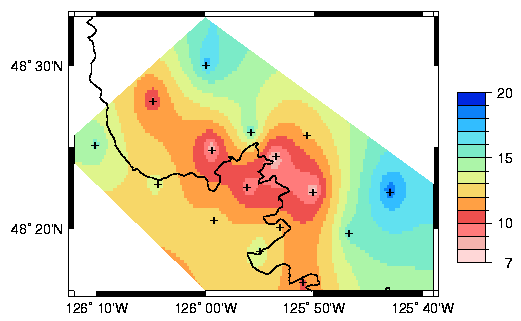
The figure at left shows upwelling over Barkley canyon. The dark line shows
the 200m isobath. Colours show the depth below the surface of a specific
salinity level - note how this water appears nearer to the surface at the
canyon mouth.
The
Strait of Juan de Fuca opens into a deep canyon that cuts across the continental
shelf. This provides a path by which deep Pacific water can upwell, or
move into shallower near-coastal areas, bringing nutrients with it. But
how does this happen? What is the difference between canyons that cut the
shelf (like Juan de Fuca) and those that don't (like Barkley Canyon)?
The figure at left shows upwelling over Barkley canyon. The dark line shows
the 200m isobath. Colours show the depth below the surface of a specific
salinity level - note how this water appears nearer to the surface at the
canyon mouth.
For the last 11 years, a network of meteorological buoys has been maintained off the BC coast. These provide real-time observations of small-scale features in the wind field. Has the climatic pattern of our coastal winds changed recently? Does this have anything to do with changes in the availability of fish and other ecosystem changes?
Faculty members are also interested in a number of coupled ocean/atmosphere (or purely atmospheric) problems. A recent topic that has made the news is El Nino - a complicated phenomenon in which the ocean and the atmosphere in the tropical Pacific work together to change the world's weather patterns. William Hsieh is developing a way to predict this phenomenon. Lionel Pandolfo is looking at the ways in which wave patterns in the atmosphere spread the effects of El Nino all over the world.
In some years, a very warm pool of water suddenly appears in the eastern
half of the equatorial Pacific. This is the El Nino phenomenon, which induces
drastic changes in the world weather. In other years, the eastern half
of the equatorial Pacific is unusually cold, a condition known as La Nina,
with equally dramatic impact on world weather. 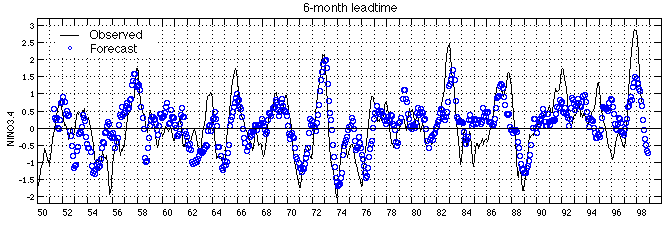 The
figure at right shows the Nino4.3 index (an index for the equatorial
Pacific sea surface temperature) as a function of time starting in 1950.
The high values of the index correspond to the El Nino years and the low
values to the La Nina years. Our 6-month advance forecasts using a neural
network model are also shown by the blue circles. While we have a fair
amount of forecast skill, we are still searching for ways to improve the
forecasts. Also, what are the precise effects of El Nino/La Nina on Canada?
Can we forecast them too?
The
figure at right shows the Nino4.3 index (an index for the equatorial
Pacific sea surface temperature) as a function of time starting in 1950.
The high values of the index correspond to the El Nino years and the low
values to the La Nina years. Our 6-month advance forecasts using a neural
network model are also shown by the blue circles. While we have a fair
amount of forecast skill, we are still searching for ways to improve the
forecasts. Also, what are the precise effects of El Nino/La Nina on Canada?
Can we forecast them too?
During an El Nino winter, news reports tend to associate every weather calamity with the occurrence of the El Nino phenomenon. But what is the actual impact of an El Nino on the world weather? Is the increase in the number of winter storms hitting the coasts of Peru and California (bringing rain, mudslides and floods) directly related to the El Nino? Will British Columbia and the Canadian Prairies always enjoy dryer and milder winters during El Ninos? Most scientists think that such changes in weather patterns are connected with the changes in tropical Pacific sea-surface temperatures that occur during an El Nino. This forcing of the atmosphere by the tropical oceans appears capable of generating wind patterns (or teleconnections) that are responsible for the changes in weather. However, atmospheric motions are chaotic. Wind patterns are produced constantly by many other causes. What proportion and what types of disastrous weather can be directly associated with an El Nino? What are the physical mechanisms linking El Nino and our weather?
The effect of volcanos on climate (L. Pandolfo)
 Volcanos
are like an open blister on the earth's surface, periodically injecting
large amounts of chemicals like sulfuric acid into the atmosphere where
they affect the radiative heat balance by reflecting sunlight and absorbing
the heat given off by the earth's surface. This leads to changes in the
stratospheric ozone and in wind patterns as high up as 20km. What
are the effects of these eruptions on our climate? How should we include
these effects in global climate models to study things like global warming?
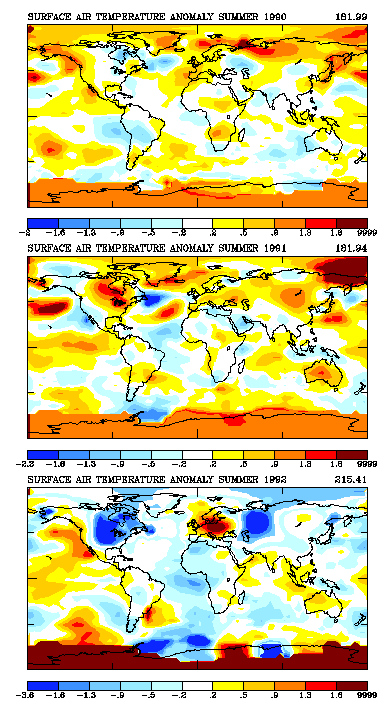
The figure at left shows how observed surface temperatures cool after the
eruption of Mt. Pinatubo in 1991. The three panels show temperature
anomalies for the summers of 1990 (top), 1991 (middle), and 1992 (bottom).
Temperatures in 1992 are up to 2 degrees colder than normal in some places
(blue patches)!
Volcanos
are like an open blister on the earth's surface, periodically injecting
large amounts of chemicals like sulfuric acid into the atmosphere where
they affect the radiative heat balance by reflecting sunlight and absorbing
the heat given off by the earth's surface. This leads to changes in the
stratospheric ozone and in wind patterns as high up as 20km. What
are the effects of these eruptions on our climate? How should we include
these effects in global climate models to study things like global warming?
The figure at left shows how observed surface temperatures cool after the
eruption of Mt. Pinatubo in 1991. The three panels show temperature
anomalies for the summers of 1990 (top), 1991 (middle), and 1992 (bottom).
Temperatures in 1992 are up to 2 degrees colder than normal in some places
(blue patches)!
Whenever a heavy fluid flows downhill underneath a lighter one, this is called a gravity current. Gravity currents and so-called hydraulic effects are fascinating phenomena that underlie many of the fast-changing events that we observe in the ocean and over land.
In the summer late afternoons, a strong wind begins to blow through
Howe Sound (creating some of the best windsurfing in the world). And yet
the winds 1000 feet up are calm. What is going on here?
Not only does surface water flow seawards through the Juan de Fuca/Georgia
Estuary, but deep water also flows inwards over the shallow sill (depth
100m) south of Victoria and eventually into the 400m deep Strait of Georgia.
This inflow is not constant, rather it comes in pulses which can be through
of as gravity currents. But many questions remain. What sets up the starting
conditions for these currents? How much water gets mixed up in their turbulent
wake?
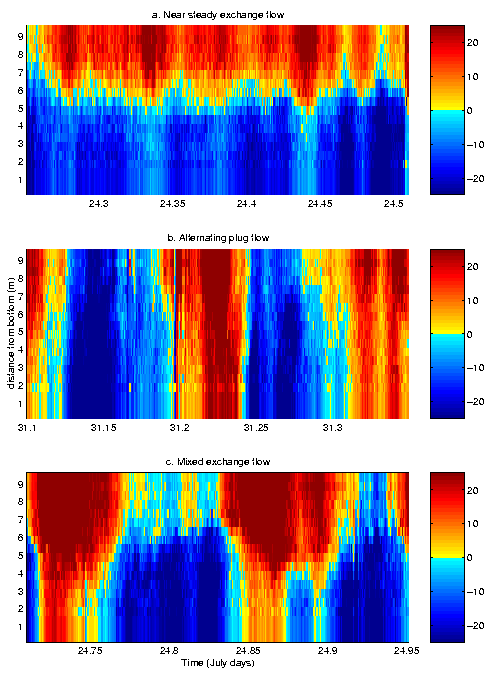 At
the western end of Lake Ontario is the narrow entrance to Hamilton Harbour.
At certain times there is a exchange flow - i.e. a surface outflow and
a deep inflow. At other times, the flow is unidirectional. The figure
at right shows a time series of velocity vs. depth. The upper panel shows
a time when flow is leftward at the top (red) and rightward at depth
(blue). The middle panel shows a period when flow is nearly constant with
depth, but oscillates in time. The lower panel shows a period when both
effects combine. This narrow channel acts as a laboratory for studying
similar flows all over the world.
At
the western end of Lake Ontario is the narrow entrance to Hamilton Harbour.
At certain times there is a exchange flow - i.e. a surface outflow and
a deep inflow. At other times, the flow is unidirectional. The figure
at right shows a time series of velocity vs. depth. The upper panel shows
a time when flow is leftward at the top (red) and rightward at depth
(blue). The middle panel shows a period when flow is nearly constant with
depth, but oscillates in time. The lower panel shows a period when both
effects combine. This narrow channel acts as a laboratory for studying
similar flows all over the world.
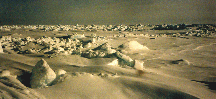
Finally, several faculty members have some interests in the Arctic. This vast and still relatively unknown region to our North is one of the frontiers of oceanography.
Polynyas are areas of the ice-covered Arctic (and Antarctic) oceans
that are relatively ice-free. Seawater is directly exposed to the air and
sun there, and so polynyas are also areas of high biological activity -
from plankton to fish to seals. In the Arctic, they often sustain local
Inuit communities. What causes these polynyas to form and remain throughout
the cold harsh polar winter? What will be the impact of predicted global
climate change on these regions?
 The region
north of Greenland is one of least-known (oceanographically speaking) places
in the world. Thick, ridged ice makes it difficult to approach with icebreakers,
and impossible to land planes. But it is here that the various flows in
the Arctic come together before flowing south into the Atlantic. What is
going on underneath this frozen plain?
The region
north of Greenland is one of least-known (oceanographically speaking) places
in the world. Thick, ridged ice makes it difficult to approach with icebreakers,
and impossible to land planes. But it is here that the various flows in
the Arctic come together before flowing south into the Atlantic. What is
going on underneath this frozen plain?
The Applied Science Faculty offers a similar opportunity as the Ocean option of the Engineering Physics degree.
For those students not interested in an Honours program a majors in Physics, Geophysics, Mathematics or Computer Science (including Math 316/Phys 312) can be combined with OCGY 308, 309, 409, 413 and 414 (taken as electives) to give a good introduction to physical oceanography. A multi-disciplinary Oceanography Majors program is planned for 1999.
For six credits of introduction to oceanography, we offer EOSC 314/315 for Arts students and OCGY 308/309 for science or applied science students.
Details for all of these programs are available from the Dept.
of Earth and Ocean Sciences, as well as on-line
.
The descriptions above show some, but not all, of our research interests.
If you want more
info, fill out a preapplication,
or contact any of us through the email addresses given in our research
pages which are linked above. Although we do not have any formal
deadlines and applications will be considered year-round, receipt of a
full application by January 15th is preferred.