
Here we present a model for predicting the non-Arrhenian temperature dependence of viscosity for naturally-occurring silicate melts at atmospheric pressure (105 Pa).
Temperature dependence of viscosity (η) is modelled by the VFT equation
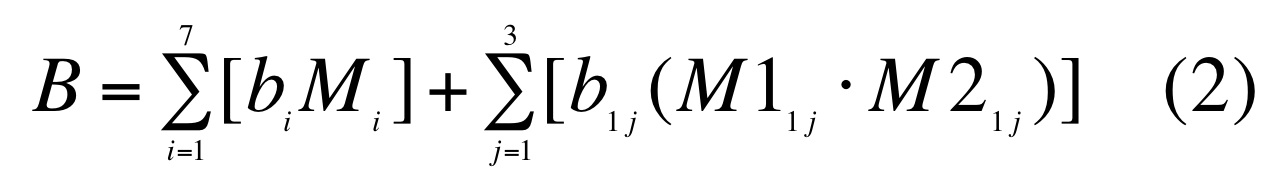
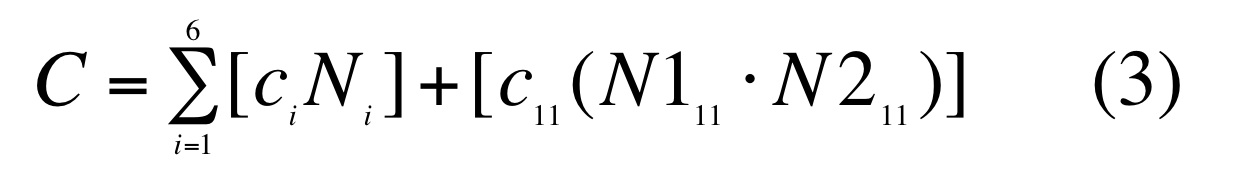
Compositional dependence is ascribed to B and C as linear combinations of oxide components
(mol%) and several multiplicative oxide cross-terms:
The model has the following attributes:
The multicomponent model is calibrated on melt compositions spanning oxide contents (wt. %) of: SiO2 (41-79), TiO2 (0-3), Al2O3 (0-23), FeOTotal (0-12), MnO (0-0.3), MgO (0-32), CaO (0-26), Na2O (0-11), K2O (0.3-9), P2O5 (0-1.2). Dissolved volatile contents vary from about 0 to 8 wt% H2O and 0 to 4 wt% F.
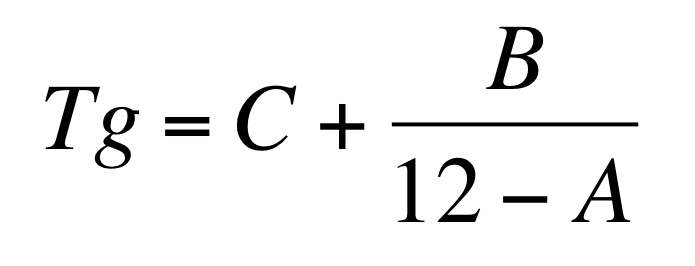
The viscosity model can be used to compute derivative transport properties of glass-forming materials, such as the glass transition temperature (Tg) and the fragility (m) of silicate melts. Tg is the temperature separating the liquid (relaxed) from the glassy (unrelaxed) state and is taken here as the temperature corresponding to a viscosity of 1012 Pa-s. This value of Tg is calculated from Eq. 1 as:
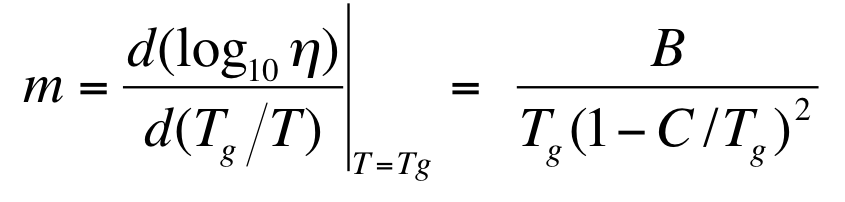
Melt fragility is a measure of the sensitivity of liquid structure and flow properties to changes in temperature and it distinguishes two extreme behaviours of glass forming liquids: strong vs. fragile. "Strong" liquids show near-Arrhenian temperature dependence and show a firm resistance to structural change, even over large temperature variations. Conversely, "fragile" liquids show non-Arrhenian temperature dependence indicating that thermal perturbations are accommodated by continuous changes in melt structure. The "steepness index" (m), as defined by Plazek and Ngai, is a common measure of melt fragility used to track departures from Arrhenian behaviour and to distinguish strong and fragile melts. Essentially, it is the slope of the viscosity trace taken at Tg and can be calculated as:
You can download the paper.
Further details on the calculations are available in the PDF file: Viscosity tutorial.
An Excel spreadsheet file can be dowloaded here: grdViscosity.xls.
Matlab© scripts for the calculations can be downloaded from this ftp site.
First, this version of the calculator has been tested successfully in OS X 10.4.11 (Tiger) with browsers Safari 3.1.1 and Firefox 2.0.0.14, cutting and pasting from TextEdit.app. We have also been successful with Windows XP Version 2002, Service Pack 2 using Firefox 2.0.0.14 and Internet Explorer 7.0.5730.11, cutting and pasting from Notepad. It should work with most up-to-date browser/text editor combinations.
Next, you have to be sufficiently confident in this web site to allow your browser to run JavaScript (at least from us). You might have to enable this in your browser preferences. If you are not happy with this, stop now and try the Excel version.
Finally, the graphic output is produced by sending and receiving data over the internet to and from the Google Chart API. You will need an internet connection for this. The chart data forms part of a URL string thus limiting to approximately 20 the number of logη vs 10000/T curves that can be plotted. This should not affect the other calculations.
The web calculator expects weight percent input in the form of a "comma separated values" (CSV) file, one line for each chemical analysis for which you want to compute the viscosity. Most spreadsheet programs allow you to export your data in "csv" form. The data can be typed or "cut-and-paste"-d into the Input Compositions textbox below.
A default set of temperatures is provided, but you can also edit the Input Temperatures field to specify temperatures at which the viscosity is to be computed.
This button will provide an example of the required input. Selecting the "Compute" button (below the textbox) will show the resulting output. The returned Model Parameters and tabulated Log(η) (as a function of T (°C)) can be "cut-and-paste"-d into your preferred computational/plotting program. Depending on your browser, the Plots can be saved as *.png files by some combination of modifier key (ctrl, alt, shift, none, etc) and right mouse-click.
The model is valid for weight percent totals between 97% and 103%. If you have analyses outside this range and still wish to proceed, you can normalize them before entering them. The analyses must comprise weight percents of the following oxides in the order and within the ranges shown below.
Note: weight % F2O-1 = 0.5*weight % F.
| Oxide | SiO2 | TiO2 | Al2O3 | FeOT | MnO | MgO | CaO | Na2O | K2O | P2O5 | H2O | F2O-1 |
| Minimum wt% | 24 | 0 | 0 | 0 | 0 | 0 | 0 | 0 | 0 | 0 | 0 | 0 |
| Maximum wt% | 90 | 8 | 40 | 20 | 3 | 45 | 40 | 15 | 15 | 3 | 15 | 10 |
Note: These calculations are done with JavaScript hence numerical results may vary slightly from those obtained in Matlab(c) or Excel(c).