ATSC 113 Weather for Sailing, Flying & Snow Sports
Wind Shear at Aerodromes (Airports) > Synoptic Scale
Learning Goal 2e. Identify the causes and typical locations of wind
shear at aerodromes (continued)
Synoptic-scale Wind Shear
The word "synoptic" means at the same time. In meteorology, this refers to weather observations that are made simultaneously around the world, to give a snapshot of the weather at that time.In the old days, weather stations were many hundreds to thousands of kilometers apart from each other -- usually at airports in major cities. As a result, if these synoptic data were used to draw a weather map, you could see only large-scale features such as highs, lows, and fronts on the map. Ever since those years, meteorologists consider "synoptic scale" to be weather features with horizontal diamaters of roughly 700 to 4,000 km.
Synoptic-scale features are somewhat pancake shaped: large in the horizontal, but thin in the vertical. As is discussed in Learning Goal 3a, almost all weather features are within the troposphere: the atmospheric layer between the ground and about 11 km altitude. Hence, highs and lows might be thousands of km in diameter, but only about 11 km thick.
Lows:
Winds are usually stronger around low-pressure centers (lows) than around highs.
The figure below shows isobars (green circles), which are lines that connect points of equal pressure. The lowest pressure is in the center, marked with the "L". The diameter of the largest circle in this example is about 1000 km, so this is a large-scale weather feature such as you would see on weather maps (which is the definition of synoptic scale). Not all lows are created equal. Some are lower than others, and have isobars more closely spaced to each other — these have stronger winds.
Near the ground, the wind direction near the earth's surface in the Northern Hemisphere is shown by the grey arrows (and the one black arrow). However, the wind that is 2 km above ground blows counterclockwise around the low in directions that are parallel with the isobars (sorry, no arrows for these are shown, so do your best to imagine them). Also, the winds high above the ground are often faster than the winds near the ground. Thus, the wind shear for this case is due to changes in both wind direction and speed.
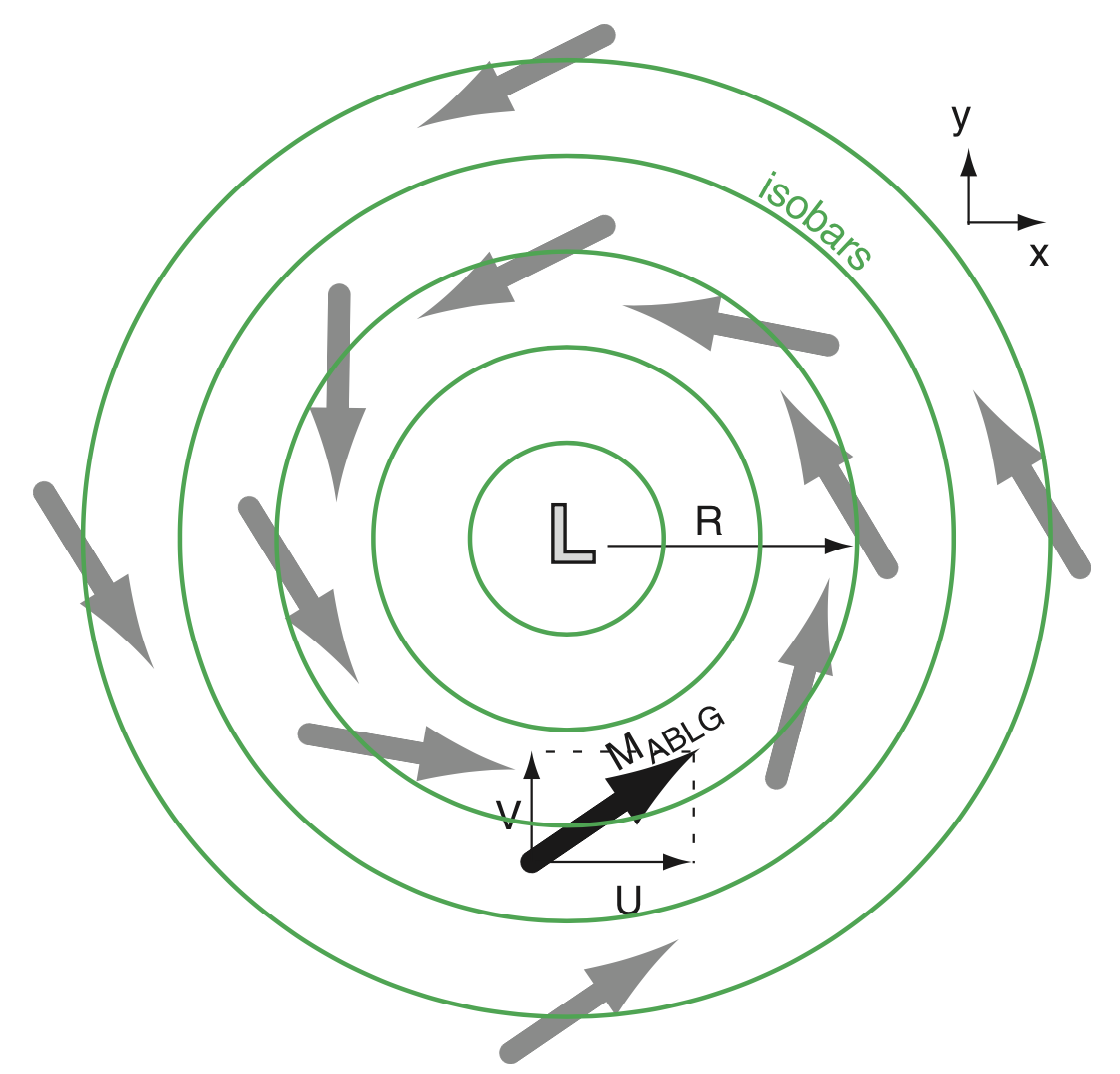
For example, in the figure above, at the black arrow, the surface wind is from the southwest, while the winds at higher altitude (not shown in this figure) are from the west (tangent to the green circle at the location of the black arrow). Thus, there is wind shear. (Legend: x points east; y points north; R is distance from the low center. Ignore the letters MABLG, which represents the surface winds.)
Solved Example:
Suppose there is a runway on the ground that is aligned with the black arrow. (a) Which direction will the aircraft be flying to approach that runway for landing? (b) While descending on approach to the airport, will there be a crosswind from the aircraft's right or left? [Hint: See the Aside box on Wind Direction and Runway Direction.]
Answer: (a) The aircraft heading will be about 230° (i.e., flying toward the southwest) so that at ground level the aircraft has a headwind coming from the southwest. (b) The aircraft descending on approach would feel a crosswind from the right (due to the wind from the west at an altitude 2 km).
Discussion: This right crosswind would be felt at all locations around the low center in the Northern Hemisphere. Test this for yourself, by assuming a runway is aligned with any one of the grey arrows (the surface wind direction) at other locations from the low center, but with 2 km winds that are tangent to the green circle at that location.
Fronts:
Fronts rotate around low-pressure (L) centers like spokes around a wheel hub. The figure below shows an example.
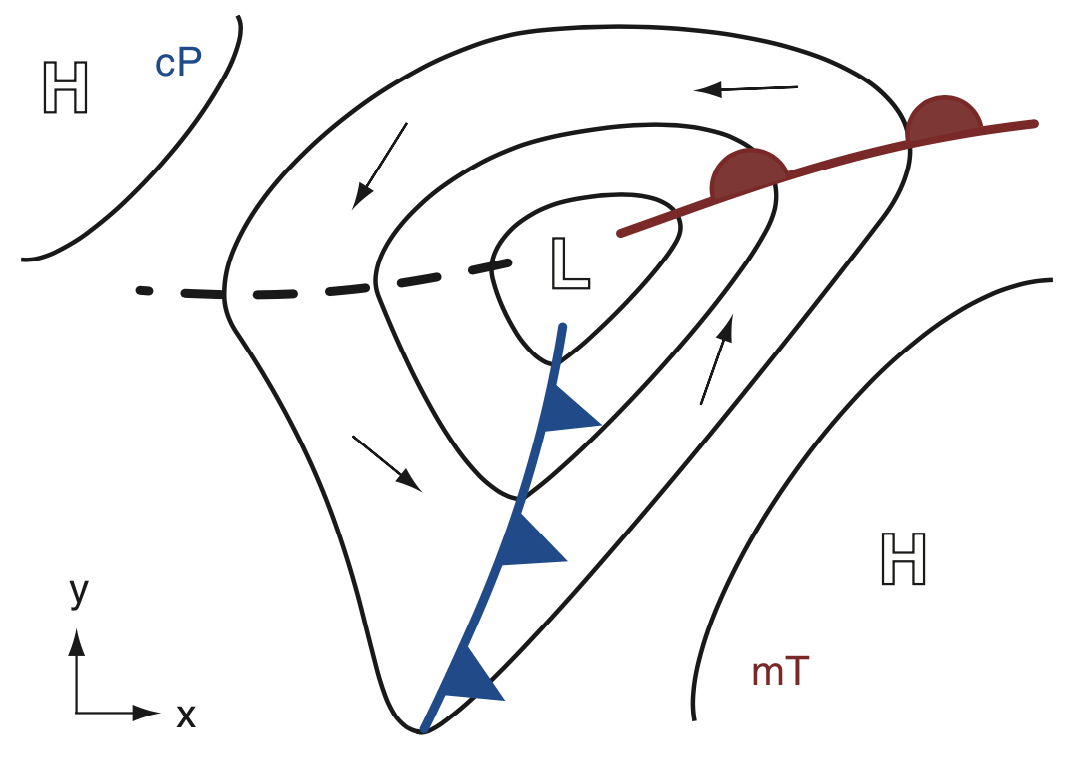
The cold front (the thick blue line with the blue triangles) is where cold air is advancing from the polar (cP) regions (in this example from northwest towards the east).
The warm front (the thick red line with the red semicircles) is where the cold air is retreating, allowing the warm air to advance from tropical (mT) regions. The thin arrows show the surface wind directions.The warm front is moving toward the north-northwest in this example.
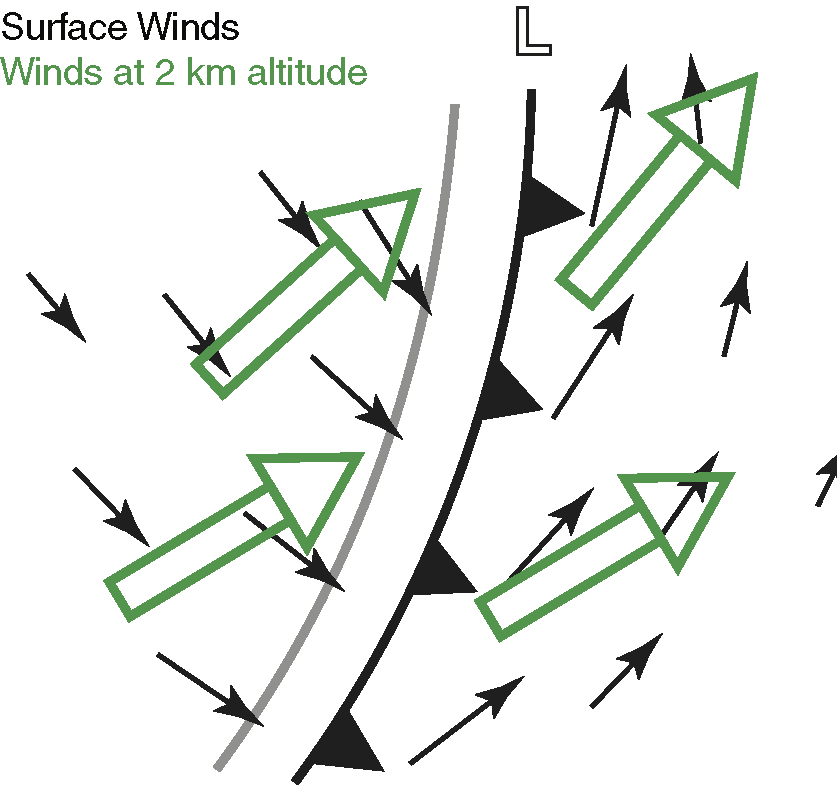
If you zoom into the cold front (figure below), you would see the shift of surface winds (black arrows) across the fronts.
But there is also strong vertical shear of the horizontal winds behind
(northwest) of the cold front. For example, the figure below is zoomed
into the cold front from the figure above. On the left
side(which is behind the cold front)
of the figure below , the surface winds (black arrows) are from the
northwest, but the winds at 2 km altitude (green arrows) are from the
southwest. That is a large change in direction - - it is wind shear.
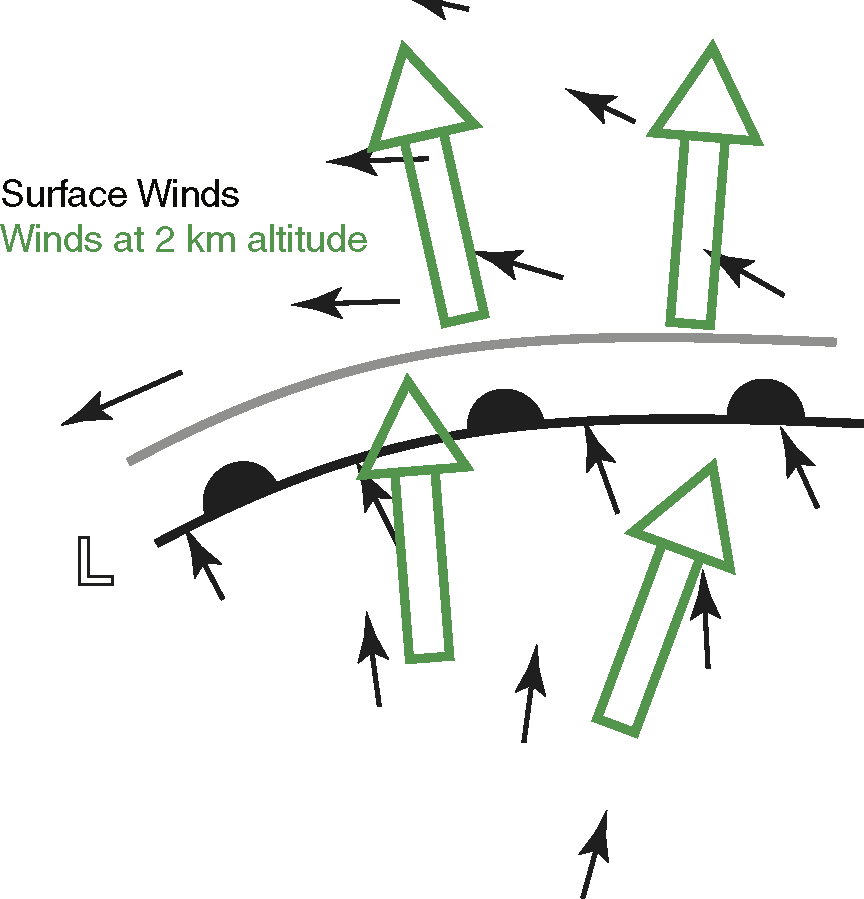
If you zoom into the warm front (figure below), you would see the shift of surface winds (black arrows) across the fronts.
Similarly, there is strong vertical shear of the horizontal winds ahead (north) of the warm front. For example, the surface winds (black arrows are from the east on average (in the top half of the figure below), while the winds at 2 km altitude (green arrows) are from the south. Again, this is a large change in wind direction - - it is wind shear.
Key words: synoptic, synoptic scale, lows, highs,
fronts, cold front, warm front, isobar
Extra info for experts; not needed for this course.
- For synoptic-scale flow around lows and fronts, see Stull, 2017: Practical Meteorology, chapters 10, 12, and 13.
Image credits. All the drawings were made by Roland Stull, and all are copyright by him and used with his permission.