Flying Module f13
Step 5. Data Available at Start of Trip
Soundings - Extra Info
Here is the same sounding, but plotted on a graph. This particular graph is a thermodynamic diagram called a "skew-T" diagram. It is very similar to the "tephigram" thermo diagrams used by Environment Canada. In this graph, the righmost thick black squiggly line is temperature (T), and the leftmost thick black squiggly line is dew-point temperature (Td). Although this sounding was made 100 km southwest of the flight departure point, the temperature and dew-point plots are probably very similar to the temperature structure over the departure point.
Wind barbs at different heights are plotted along the right axis, but these are not to be trusted. The reason is that the Quillayute sounding site is on the opposite side of the Olympic Mountains from the departure point for this flight, causing the winds in the plotted sounding to be channeled differently than the actual wind at the departure point. For the meanings of all the other lines, see skew-T details from Stull's 2016 Practical Meteorology book, Chapter 5, page 124.
Observed at 00 UTC (4 pm local time) the afternoon of the flight.
UIL = Quillayute, WA, USA, (just south west of Victoria, BC).
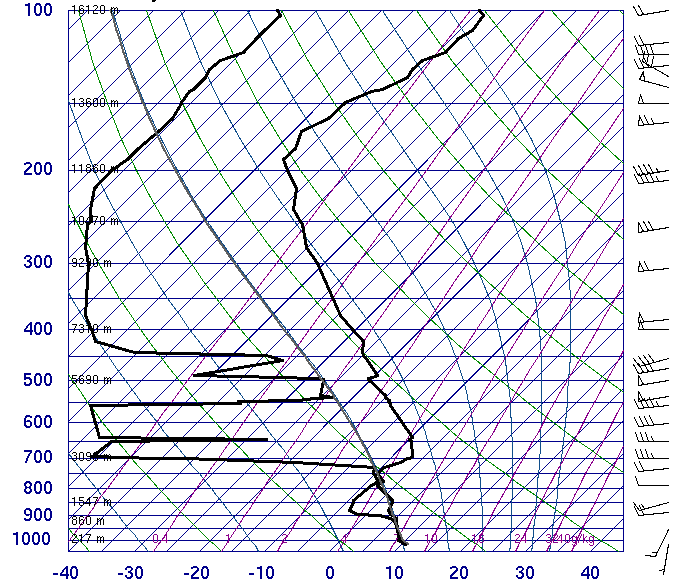
Interpretation: A humid, turbulent layer of air called the boundary layer extends from the surface up to about 740 hPa (= 74 kPa). In this boundary layer are multiple layers of low clouds. Capping the boundary layer is a 3°C temperature inversion, with fairly dry air aloft.