| |
Summary
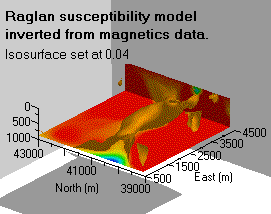
| This case history illustrates 3D inversion of an airborne magnetics survey over the Raglan deposit in northern Quebec. Results are presented as a model of susceptibility contrast, where host rock susceptibility is assumed to be zero. The results of inversion helped answer some questions about the subsurface relationship between two outcropping units. A drill hole spotted based upon inversion results confirmed the existance of a subsurface ultramafic flow near 650 metres depth connecting the two outcrops. |
 |
Regional setting
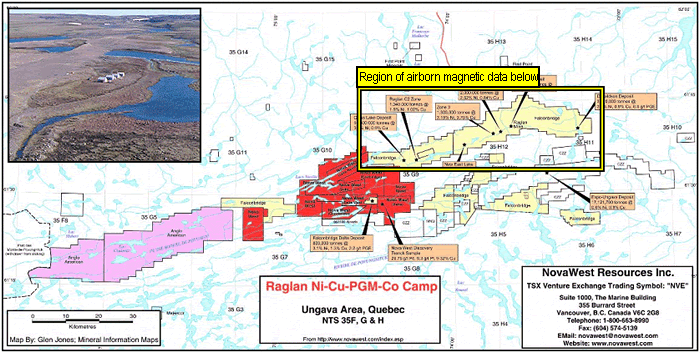
This map shows how busy exploration has been in this area. Blocked out areas show claims that are worked by various companies, and the photo shows the NovaWest Resources camp. Both images are from NovaWest's website, dated May 2003.
An airborne magnetic data set gathered over the whole Raglan Region is shown next. This map is from Finding Nickel from the B-field at Raglan - ‘To B or not dB’, R. Osmand, et al, CSEG Recorder, November 2002.
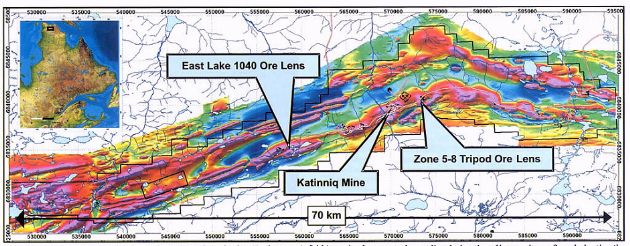
Move your mouse over the image to see the data set used in this inversion case history, and its relation to the area.
Physical properties
There must be significant variations in physical properties between rock types if geophysics is to provide useful information. At Raglan, the structural trends are clearly well imaged by the large scale airborne total field anomaly map. In fact, the image to the right shows how the ore bodies and hosting ultramafic rocks both tend to be magnetic compared to sedimentary country rocks. This means that magnetic anomalies will be related to both the targets themselves, and to rocks which are likey to host ore bodies.
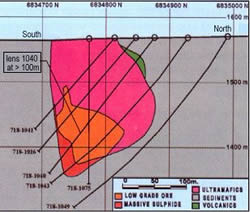
| Cross section of geology at the East Lake 1040 Ore Lens, labelled in the airborne magnetics map above (from Finding Nickel from the B-field at Raglan - ‘To B or not dB’, R. Osmand, et al, CSEG Recorder, November 2002).
- Grey rocks are host sediments.
- Green rocks are volcanics.
- Pink rocks are ultramafics (susceptibility 0.03 - 0.07 S.I.).
- Orange rocks are low grade massive ore (susceptibility 0.03 - 0.07 S.I).
- Red rocks are the primary massive sulphide ore (susceptibility 0.03 - 0.07 S.I.).
|
 |
|
|