ATSC 113 Weather for Sailing, Flying & Snow Sports
6 - Snowsports: Winter Mountain Weather
Learning Goal 6e: Identify and explain orographic lift and lee shadowing.
Orographic uplift
In the flying section of this course, you learned about fog and cloud. When air advecting (moving) horizontally reaches a barrier such as a mountain or mountain range, it must travel up and over it. The study of mountains is called orography, and so when air lifts up and over mountains it is called orographic uplift (Fig. 6e.1). As the air ascends, it cools down adiabatically, meaning for each kilometre it rises, it cools by nearly 10°C.
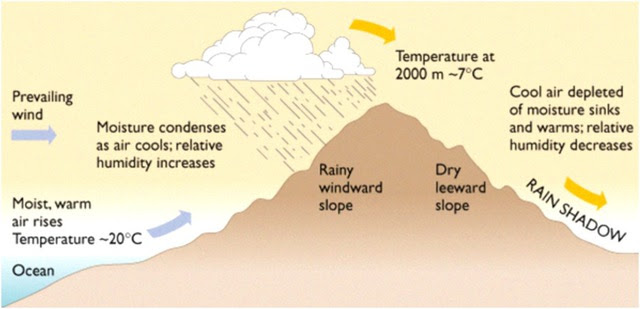
Fig. 6e.1 - The process of orographic uplift and lee shadowing with moist air advecting off the ocean. (Credit: NOAA).
If the rising air is humid — in southwest BC for example, air frequently advects from the ocean — as it cools to its dew point, it condenses and clouds form (Figs. 6e.2-6e.4), often precipitation too. As lifting and cooling continues further, the cloud droplets grow large enough that they fall out of the clouds as rain. When it is cold enough, ice crystals grow to form snow. It is important to note that once the air is saturated, the rising air now cools at a slower rate. This is the wet adiabatic lapse rate, which is closer to 6.5°C for every kilometre ascent (instead of 10°C).
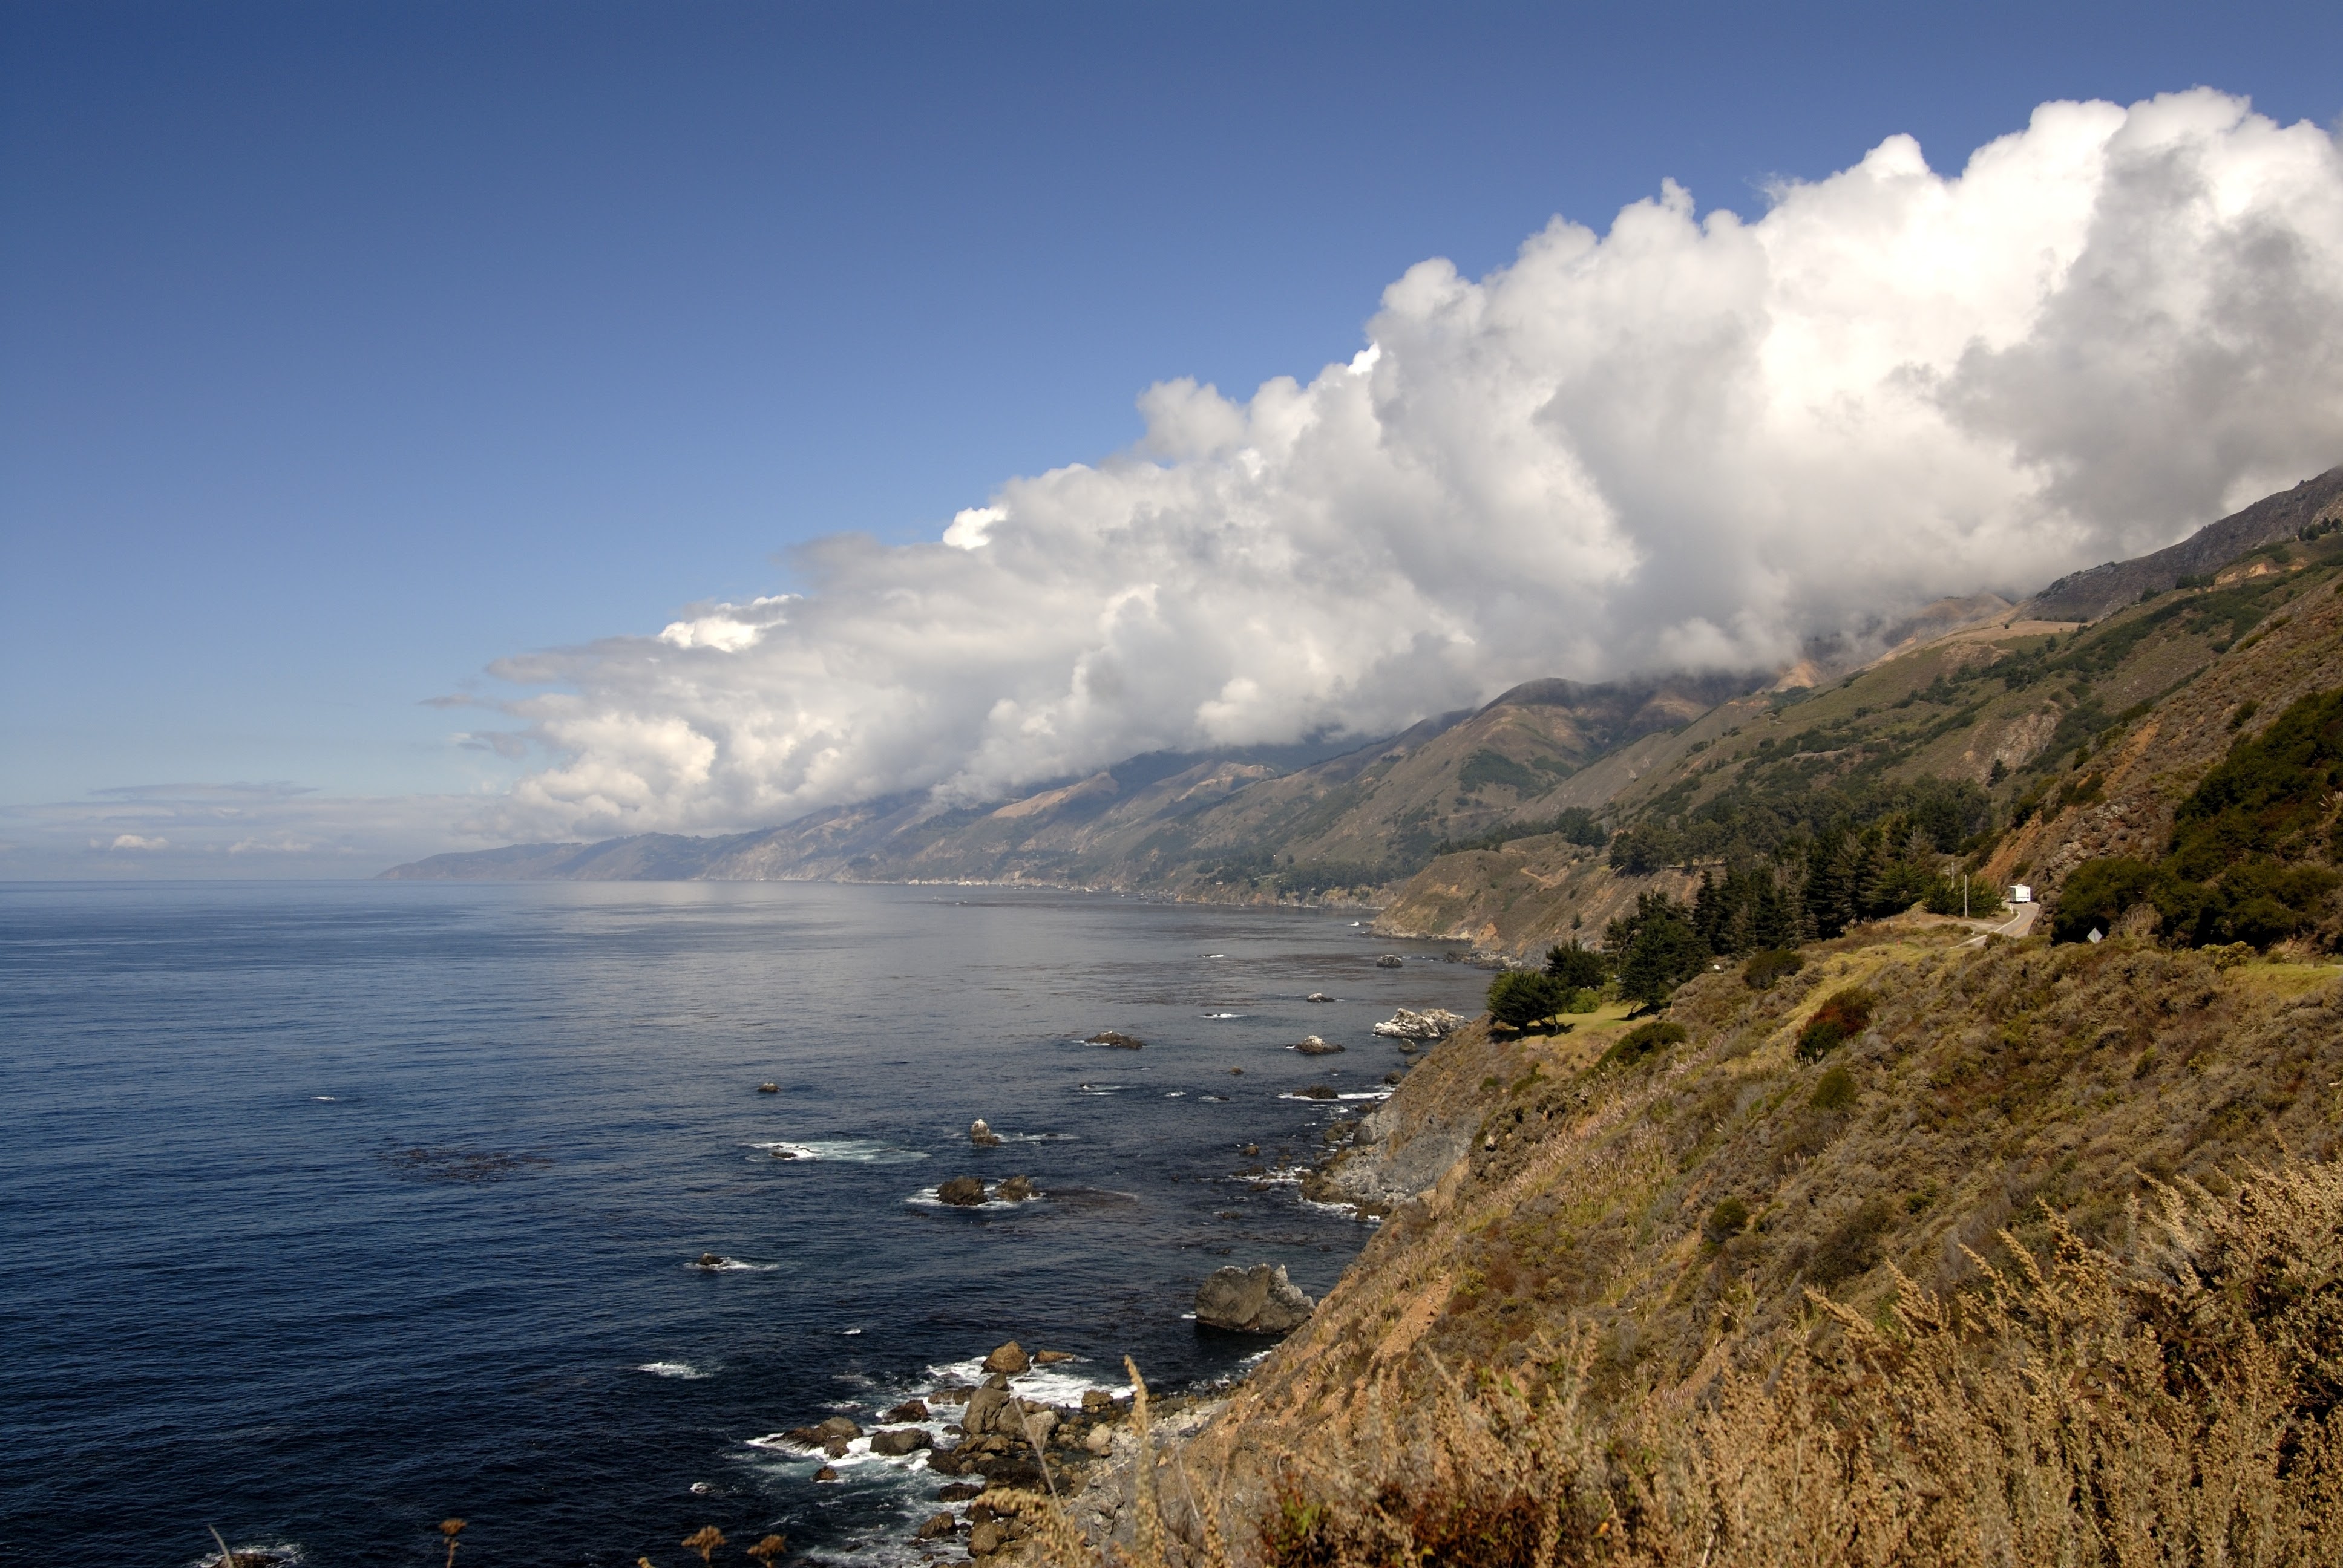
Fig. 6e.2 - Orographic lift of moist air coming off the ocean produces clouds along the Santa Lucia Mountains south of Monterey, California, USA (Credit: NOAA).
As an example, the North Shore mountains immediately north of Vancouver often experience heavy rain and snowfall due to orographic uplift. Winds approaching those mountains often do so approximately perpendicular (at right angles) to them, so the mountains form the barrier necessary for this effect. This can be really good for skiing if the freezing level is low enough, as heavy snowfall can result.
Remember to always consider the freezing level along with other weather factors (see Learning Goals 5a and 6h for deriving temperatures from pressure-level maps) when planning a ski trip! The negative side is that the clouds and precipitation may cause poor visibility. Further, the North Shore mountains are at a lower and thus warmer elevation, which means that rain occurs fairly regularly. Unfortunately this also means that the ski areas there are particularly susceptible to climate change, as the average freezing levels continue to gradually rise.
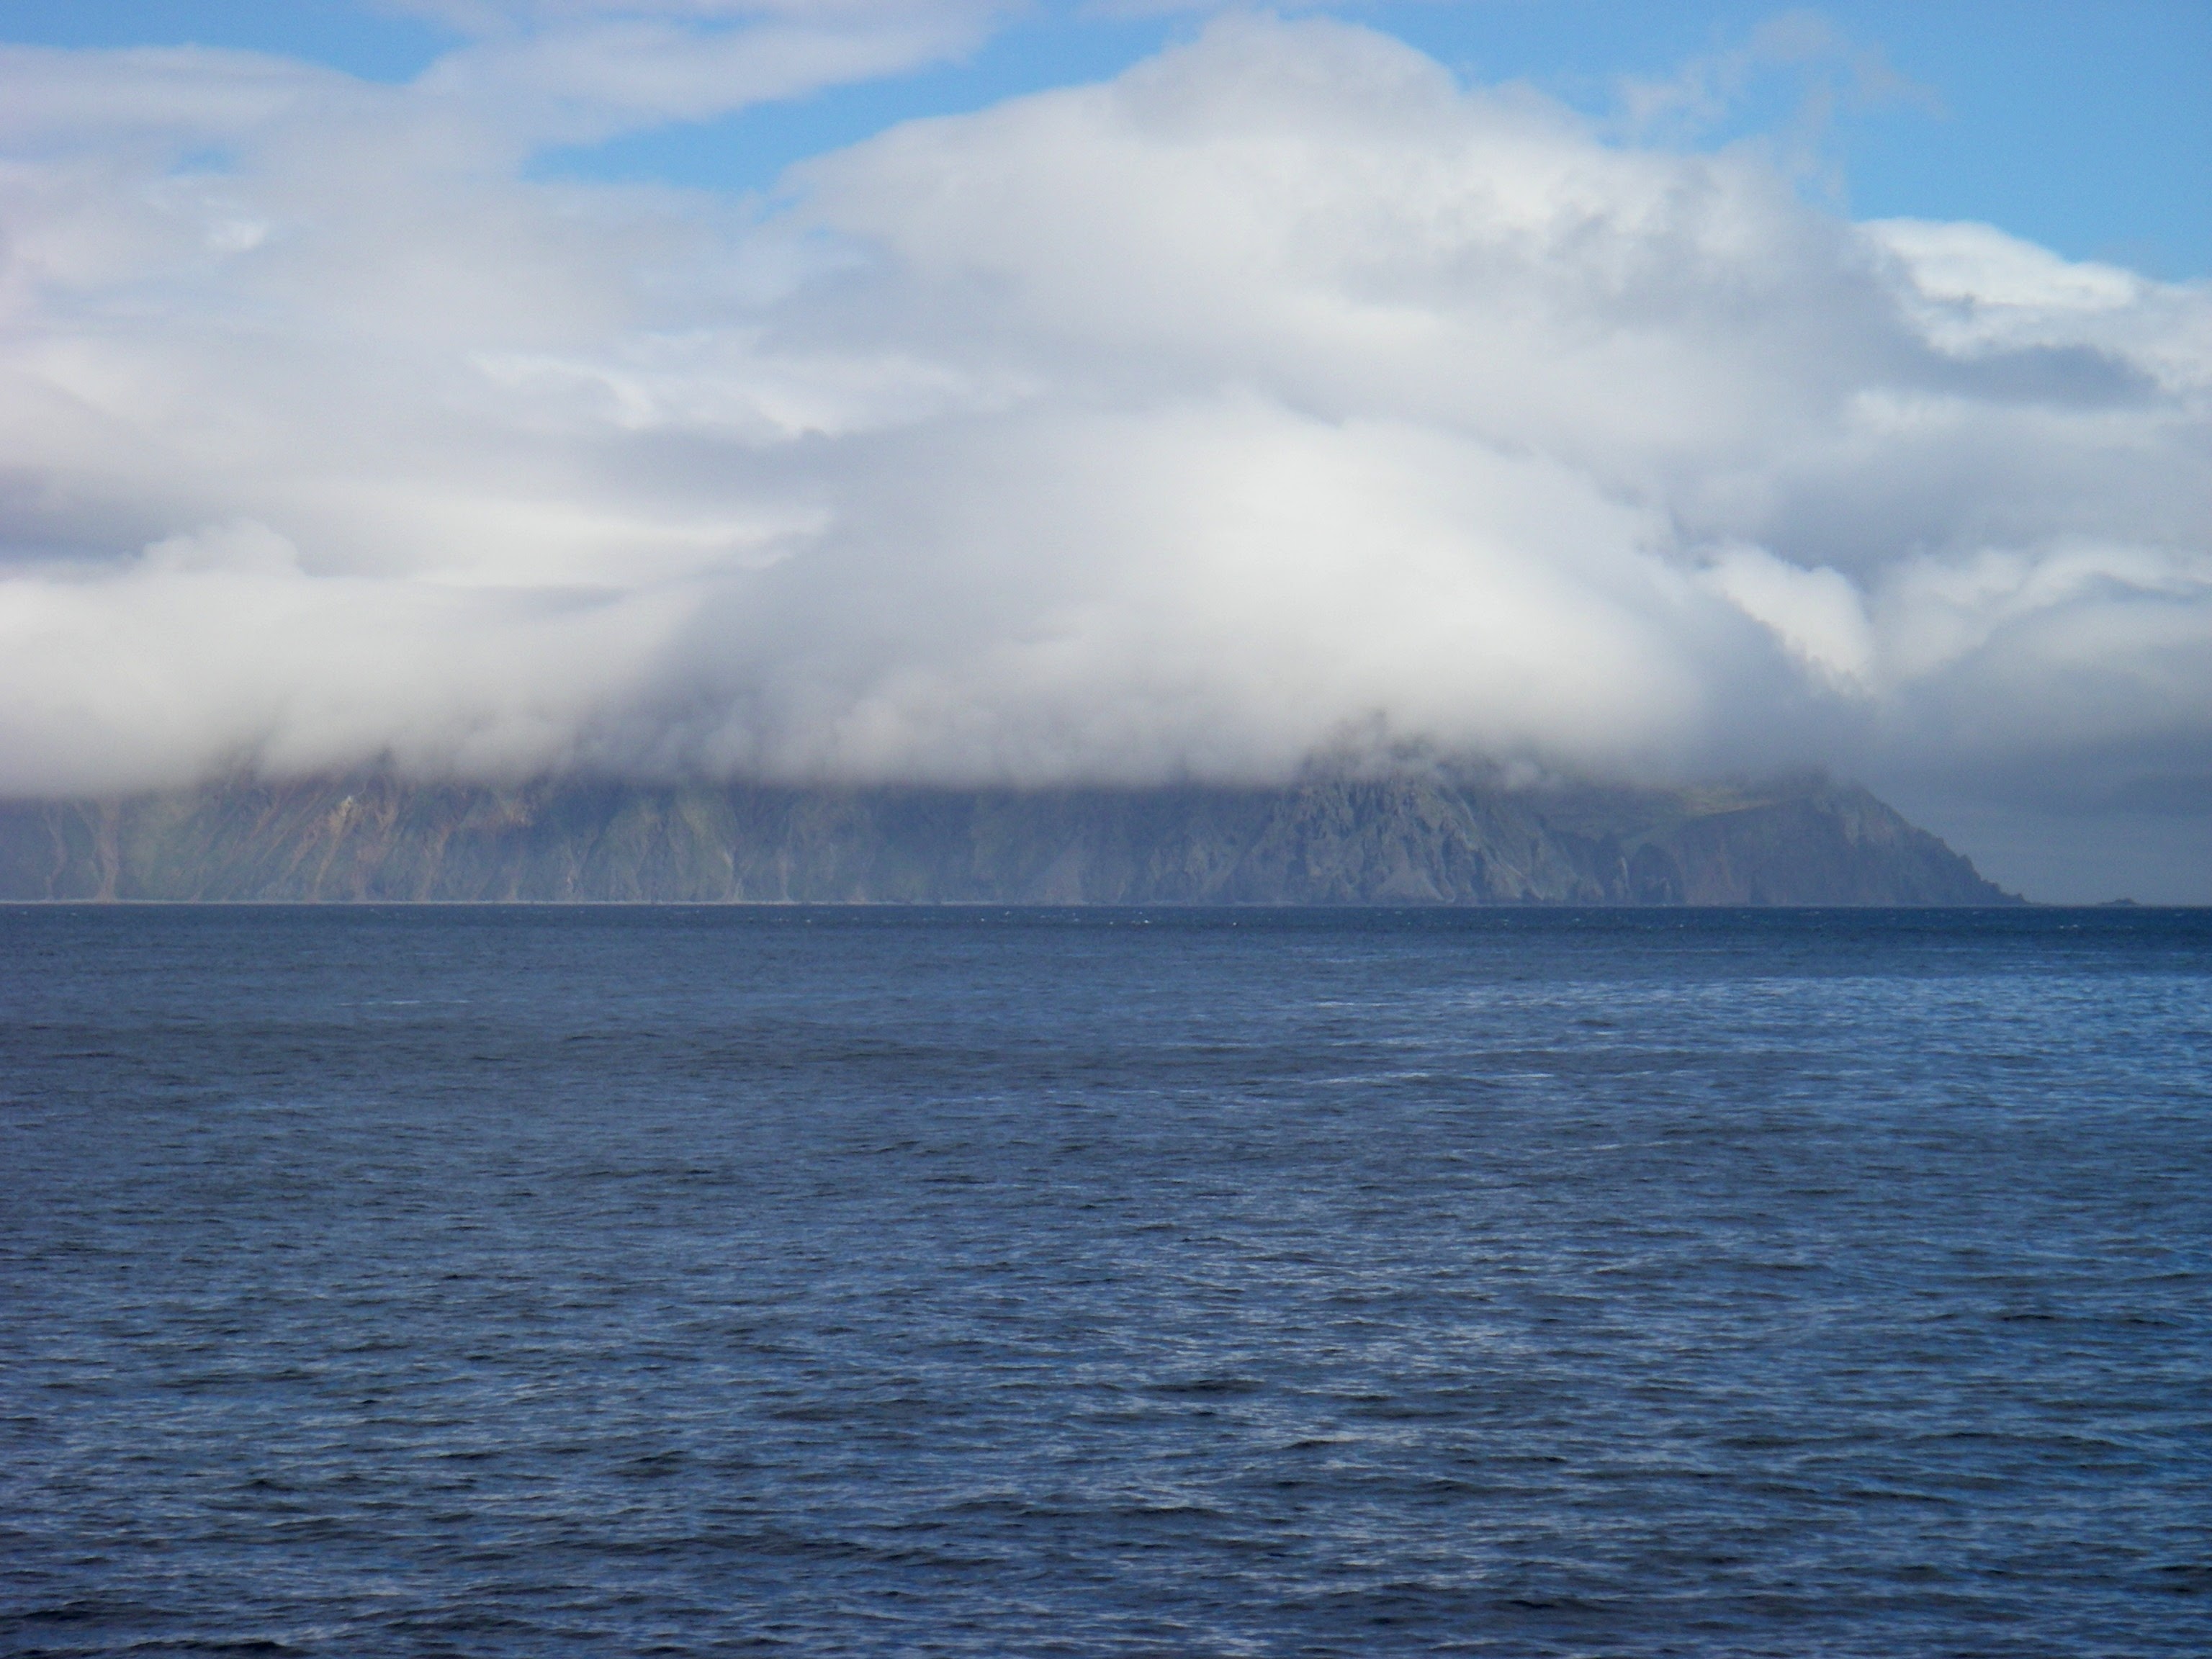
Fig. 6e.3 - Orographic lift forming clouds over the Aleutians, off the coast of Alaska. From Teacher at Sea program, NOAA Ship OSCAR DYSON (Credit: NOAA.)
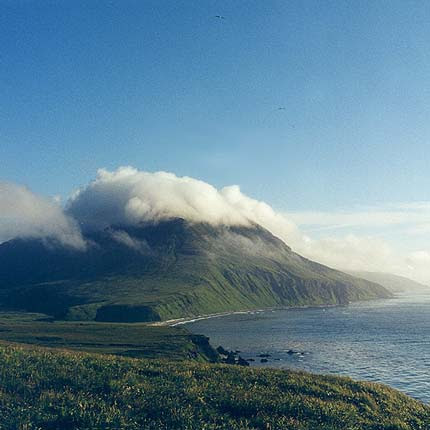
Fig. 6e.4 - Orographic cloud at the top of a mountain. (Credit: NASA.)
Lee shadowing
Now consider the air as it descends on the leeward side of the mountain (see Fig. 6e.1). Since moisture was removed from the airmass in the form of precipitation as it ascended the windward side, it is now drier on the lee side. Now that the air is no longer saturated, as it moves vertically downward, it changes temperature at a faster rate again (warming adiabatically, at ~10°C per kilometre).
So as it descends down the leeward side, it warms faster than it had cooled on the windward side (recall that the cooling rate slowed to the wet adiabatic lapse rate once the air was saturated). The final result is that the air is warmer and drier after crossing the mountain barrier. This process is known as airmass transformation. The lack of rain and cloud in the lee of a mountain is known as lee shadowing or a rain shadow.
Note that if the air approaching the mountains is dry, it is possible that the orographic lift will not lead to precipitation or even cloud. This can happen at inland locations away from the coast, or if the air has already been dried out from traversing a mountain range previously.
Identifying orographic lift and rain shadow events
You can often see the orographic lift and lee shadowing effect when looking at satellite or radar images, or weather forecast model output. Figs. 6e.5 and 6e.6 show numerical weather forecast output of precipitation for southwest BC and Washington, USA. The colours (blues, greens, yellows, etc.) represent different intensities of precipitation — in this case, snow. The scale is along the bottom of the figure.
Higher snowfall rates are present at higher elevations as colder temperatures condense and precipitate more moisture out of the air, and orographic lift is maximized at higher elevations. To help you see where the mountains are, Fig. 6e.7 shows a terrain map covering the same region as Figs. 6e.5 and 6e.6.
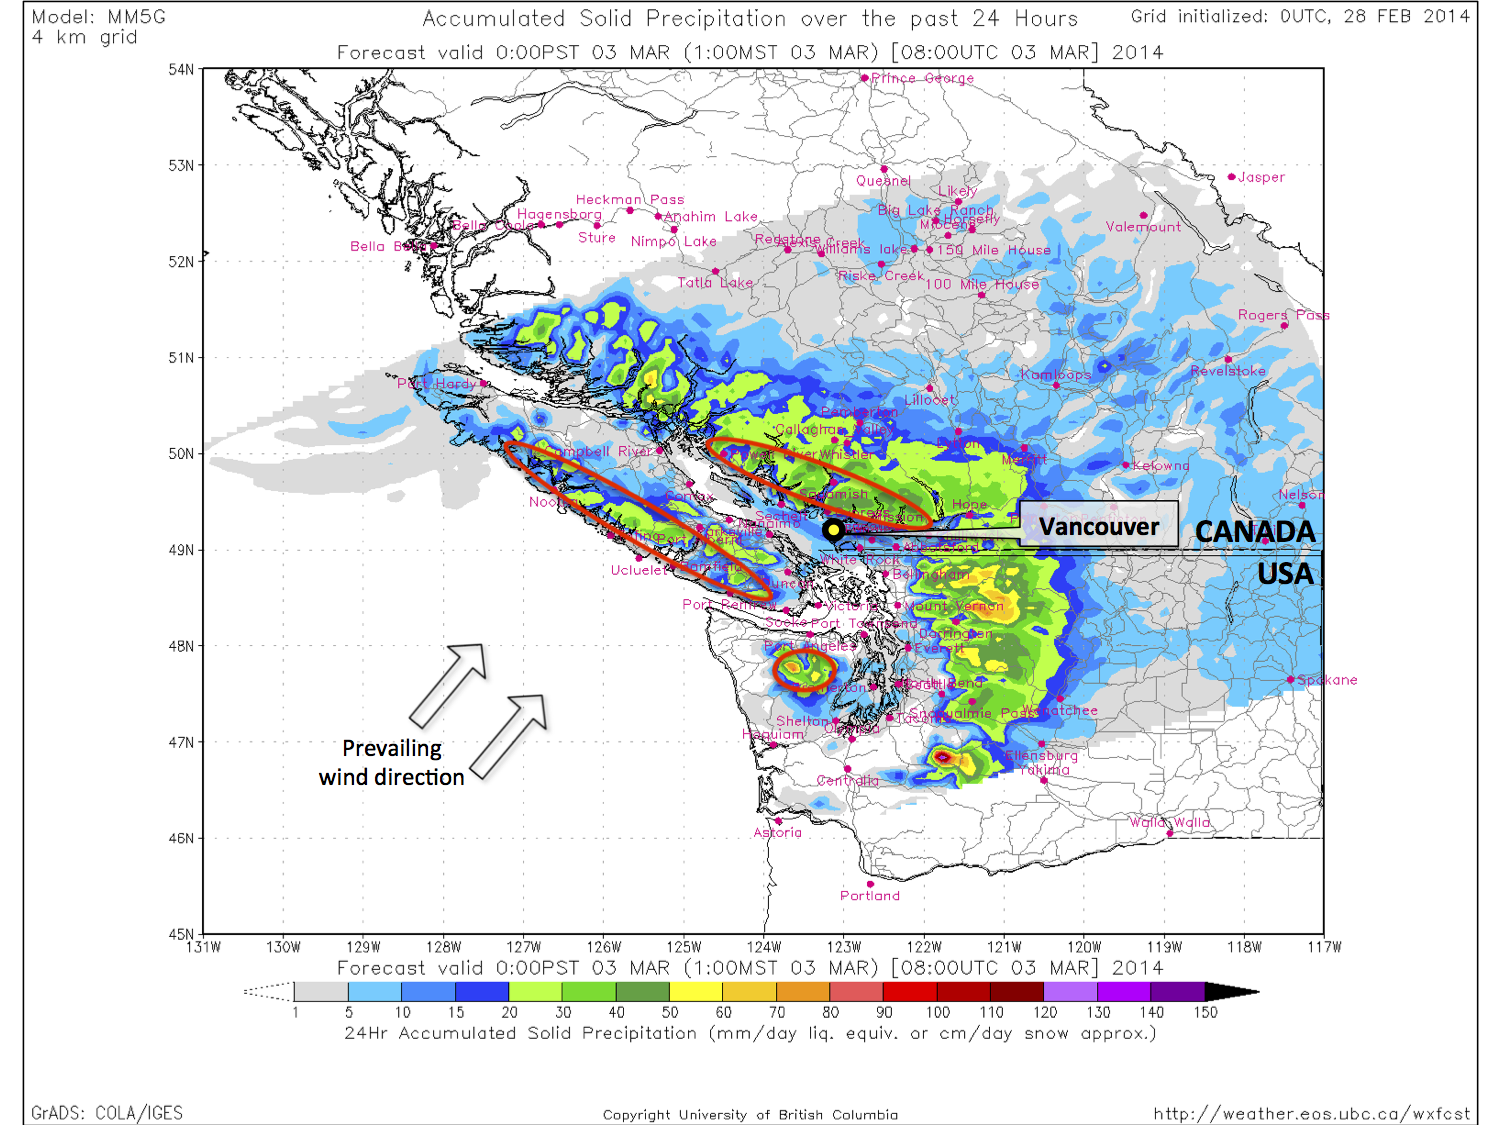
Fig. 6e.5 - Numerical weather prediction output of precipitation (blues, greens, yellows), in this case solid precipitation or snow. Some regions of orographic uplift are highlighted with red circles. This effect is strongest when the winds are perpendicular to the mountains, as shown by the prevailing wind direction (arrows). Compare with the terrain map in Fig. 6e.7. (Credit: Stull.)
Look at Fig. 6e.5. On this day in March 2014, the forecasted wind direction is such that the air travels straight towards the coastal mountains of Vancouver Island and the BC mainland. This air experiences orographic uplift (highlighted by the red circles) and the freezing level is low enough so that the resulting precipitation falls in the form of snow over the mountains. Specifically, this map shows the forecast of daily (24-hour) accumulated snowfall. In some places at higher elevations, where the map is yellow/orange, the snowfall amount is 50 cm or more — that's over half a metre! — demonstrating how intense orographic effects can be.

Fig. 6e.6 - Numerical weather prediction output of precipitation (blues, greens, yellows), in this case solid precipitation or snow. Some regions of lee shadowing are highlighted with red circles. This effect is strongest when the winds are perpendicular to the mountains, as shown by the prevailing wind direction (arrows). Compare with the terrain map in Fig. 6e.7. (Credit: Stull.)
Now look at Fig. 6e.6. This is the same forecast for the same time. However, the red circles on this map are now highlighting some regions where lee shadowing is occurring and there is lower intensity or no snowfall, like right behind the Olympic Mountains to the south in far western Washington, and in between Vancouver Island and the BC mainland. It is possible that there is precipitation falling as rain in these low elevation regions; however, the orographic effect is nevertheless still apparent as the intensity decreases significantly as you move from southwest to northeast across the mountain ranges.
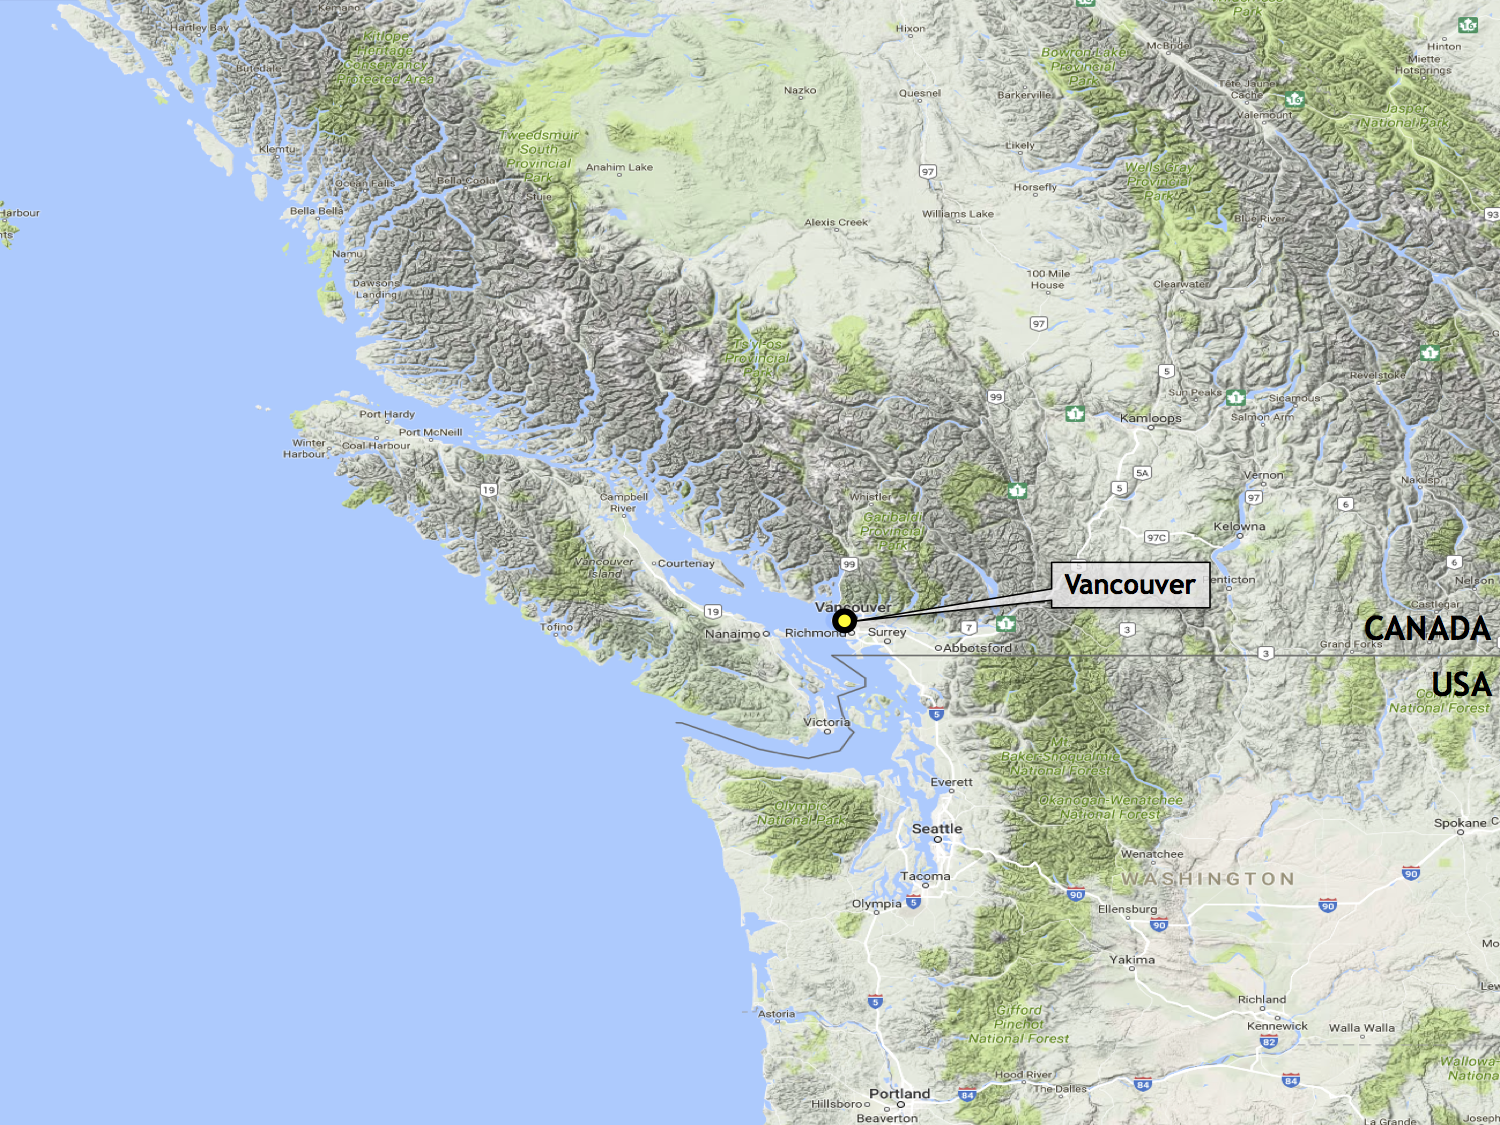
Fig. 6e.7 - Terrain map of the same region as in Figs. 6e.5 and 6e.6 for comparison. (Credit: Google.)
Lastly, note that the snowfall maps we looked at are weather forecasts, as predicted by numerical weather prediction (NWP) models. The amount of snowfall in real life may be more or less than shown in the forecast maps, depending on how accurate the forecast is. Remember that numerical weather prediction models make lots of approximations and so the output is also approximate and contains errors. These errors get worse as you go farther into the future. Nonetheless, these models are still the most useful tool in weather forecasting.
Key words: orographic uplift, adiabatically, dew point, airmass transformation, lee shadowing, rain shadow
Figure Credits: Howard: Rosie Howard, West: Greg West, Stull: Roland Stull