| |
Page Contents:
First, the three geophysical surveys are discussed individually, including 2D resistivity inversion results from both the UBC-GIF and the Res2DInv programs. Then geological interpretations are made using all three data sets. Corroborating information includes some preliminary borehole data and correlations with vegetation visible on aerial photographs.
Click here to display all figures in a separate window.
Individual geophysical data sets
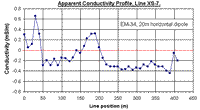 EM-34 apparent conductivity EM-34 apparent conductivity
EM data were gathered using both horizontal and vertical dipole configurations. However, low signal levels associated with the vertical dipole mode, and the very low ground conductivities, resulted in usable data being obtained only with the horizontal dipole mode. Interpretation remarks follow: (Click small figures for full sized versions.)
- Apparent conductivities in the top 15-20 metres were less than 1 mS/m everywhere.
- In many areas the instrument indicated conductivities were less than zero. Negative electrical conductivity is physically meaningless, but the instrument tends to produce such results when signals drop below the detection threshold, i.e. in very resistive conditions.
- There are well defined regions where conductivities increase, for example between 150 and 200 metres on this line.
- The maximum conductivity in this region of around 0.3 mS/m corresponds to a resistivity of 3,300 Ohm-m, in agreement with inverted resistivity results for that zone. Recall that EM-34 conductivities represent on average an ellipsoidal region roughly 30 metres wide and 15 metres deep centred under the midpoint between the two coils.
- Relatively high conductivities at the eastern end of the line are likely due to a steep slope east of the instrument.
 Ground penetrating radar Ground penetrating radar
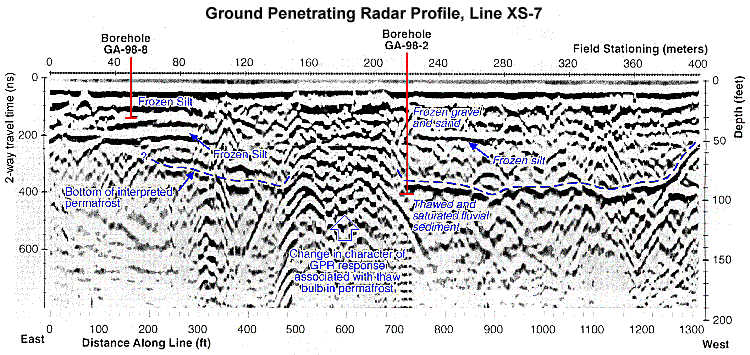
Overall, signals appear to useful down to roughly 800 ns of two-way travel time. The depth scale was generated by comparing the strong reflection to the base of permafrost found in boreholes. The depths to features within frozen ground will, therefore, be fairly well constrained, while depths to features in thawed zones will be less constrained. Typical velocities in saturated, thawed gravel, are roughly 0.06m/ns, or less than half the velocity in frozen ground. (Click small figures for full sized versions.)
- The distinct reflector at approximately 27 metres is observed along much of the lines surveyed with GPR. On lines perpendicular to the one shown here, this reflector becomes shallower to the west, as lines approach the nearby river.
- There is a distinct change in echo characteristics between stations 150 and 210. Signals are more chaotic, there are more small-scale hyperbolic diffraction patterns, and linear reflecting horizons are interrupted.
- There are several flat-lying discontinuous reflectors observed between surface and 30 metres.

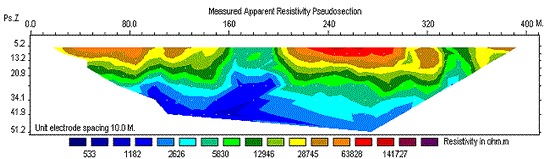
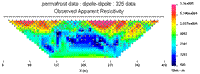
Data pseudosection (Res2dInv)
Data pseudosection (ubc-gif) |
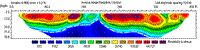
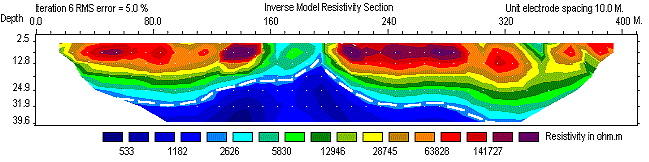
Res2dInv inversion result |

DCIP2D inversion result. |
Electrical imaging
DC resistivity surveys at this site were performed using an automated data acquisition system, so it was cost effective to obtain data using all three of the common arrays, namely Schlumberger, Wenner and dipole-dipole arrays. In the field, dipole-dipole data were too noisy for direct interpretation, so the data from other arrays were used. However, it is the dipole-dipole data that were inverted and interpreted because they tended to have higher spacial resolutions.
Information about the ground obtained from the model generated by 2D inversion can be summarized as follows:
- The model shows a very wide range of resistivities (200 - 250,000 Ohm-m). This is not unexpected when frozen and unfrozen ground are both involved.
- There are generally high resistivities in the upper 30 metres, underlain by less resistive material.
- On lines perpendicular to the one shown here, the resistive material pinches out towards the west where the river flows, and presumably keeps ground unfrozen.
- There is an isolated pocket of low resistivity material (or thaw bulb) extending from depth to ground surface between stations 150 and 205.
- Based upon GPR results and borehole data, the 2,500 Ohm-m contour was interpreted to be the base of permafrost. This is consistent in both the Res2DInv and UBC-GIF inversions, so a dashed line has been placed on the interpreted sections to show how the base of permafrost varies under this survey line.
- In the inversions of dipole-dipole resistivity data discussed here, all resistivity models became more resistive below 70 metres. The fact that this zone was visible on all inversion models is fairly strong evidence that the feature is real, possibly indicating that bedrock has been imaged.
Geological interpretations
Permafrost
- Based on the very high resistivities, the base of permafrost is interpreted to be between 20 and 30 metres deep (except near the so-called thaw bulb).
- This thickness is interpreted from the strong GPR reflection observed at roughly 30 metres, and is supported by borehole information. On resistivity models, this thickness corresponds to the 2,500 Ohm-m contour.
- Because the survey was done before spring thaw, the active zone at the surface was not thawed. Therefore, it is not possible to determine the top of permafrost using these surveys.
Thawed regions
- Low resistivity material below 30 metres suggests material is thawed. This is supported by preliminary data from a borehole, which encountered predominantly frozen gravel and sand, with occasional silt and cobbles, to a depth of 95 feet (29 metres). This was underlain by thawed and saturated fluvial sediments.
- The isolated pocket of low resistivity material between 160 and 210 shows excellent correlation on all three data sets. The low resistivity values in EM-34 and DC resistivity results, and the high-amplitude scattering echoes on GPR data suggest that the sediment is thawed in this area. The feature is interpreted to be a thaw bulb in the permafrost.
- The many hyperbolic diffractions observed within the thawed region suggest that the sediment in the flood plain is predominantly coarse-grained. This also is consistent with borehole data.
- Where it exists, silty material is likely limited to discontinuous layers. Some evidence for such features is evident as discontinuous linear reflectors within the permafrost zone. See the annotation on the GPR figure.
[top]
Correlations with vegetation and surface features
- There is good correlation of all geophysical and borehole data, with variations in vegetation observed at the surface. This is also apparent on aerial photographs.
- Regions of permafrost are covered predominantly with sparse and stunted black spruce, while regions interpreted to be thawed are covered with large pine trees.
- There is also excellent correlation with an abandoned stream channel evident on the aerial photographs. This is the zone between 160 and 210 metres on the survey line discussed in this case history.
- The correlation between geophysical results and vegetation was used to interpolate the interpreted permafrost/thawed boundary between geophysical survey lines, allowing the interpretation of this feature to be extended across the field site with minimal additional field work.
[top]
Bedrock
- The top of bedrock was not definitively resolved by geophysical data. Steeply dipping interfaces were detected on the eastern ends of GPR lines perpendicular to the one shown here, but these reflectors could not be traced for more than 60 metres from the base of the adjacent slope.
- Maximum penetration of GPR and resistivity surveys was estimated in the field to be roughly 45 metres. Since bedrock was not apparent within this range, this depth was concluded to be a useful minimum bedrock depth in these areas. Such constraining conclusions were adequate for the goals of the survey.
- In the subsequent inversions of dipole-dipole resistivity data, all models became more resistive below 70 metres. Since this zone occurred in all inversions, it is fairly good evidence that the thawed region below permafrost is, in turn, underlain by material that is roughly 10 times more resistive. This is likely an indication that bedrock occurs in the vicinity of 70 metres deep under the northern half of this line.
Recall that all figures for this page can be displayed in a separate window. The two recovered resistivity models have annotations that are activated by moving your mouse over the figures.
Click here to display all figures in a separate window.
|
|