ATSC 113 Weather for Sailing, Flying & Snow Sports
Cloud Coverage
Learning Goal 1c. Relate cloud coverage amounts to the visual appearance of the sky.
Pilots flying visually (VFR, see Learning Goal 1g) must stay outside of clouds. Even those flying in instruments (IFR) are concerned if there is a low overcast (i.e. a low ceiling) over their destination airport. For this reason, cloud coverage is important to pilots.
The fraction of the sky (celestial dome) covered by cloud is called sky cover, cloud cover, or cloud amount. It is measured in eights (oktas) according to the World Meteorological Organization (WMO). Table 9-10 gives the definitions for different cloud amounts, the associated symbol for weather maps, and the abbreviation (Abbr.) for aviation weather reports (METARs = Meteorological Aviation Reports). For aviation, the altitude of cloud base for the lowest cloud with coverage ≥ 5 oktas (i.e. lowest broken or overcast clouds) is considered the ceiling (see Learning Goal 1d).
Sometimes the sky is obscured, meaning that there might be clouds but the observer on the ground cannot see them (see Learning Goal 1i). For obscurations, the vertical visibility (VV) distance is reported as a ceiling instead (see Learning Goal 1e).
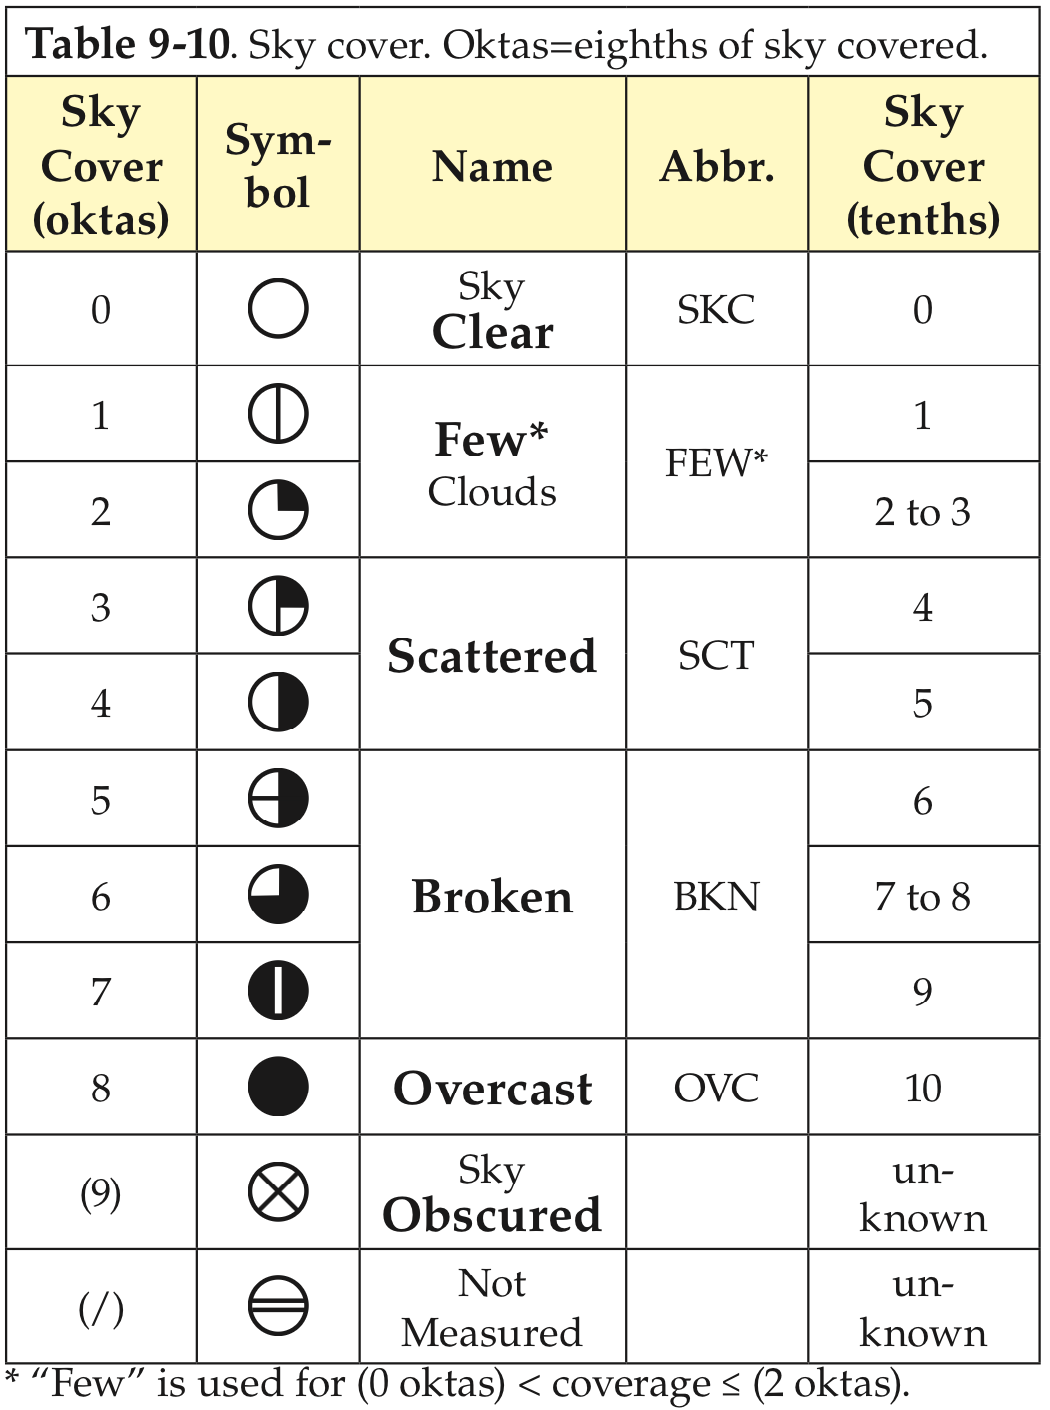
From Stull, 2017: Practical Meteorology: An Algebra-based Survey of Atmospheric Science.
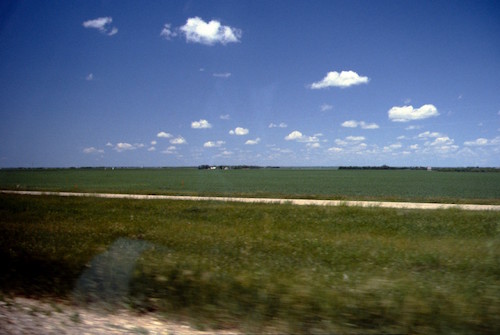
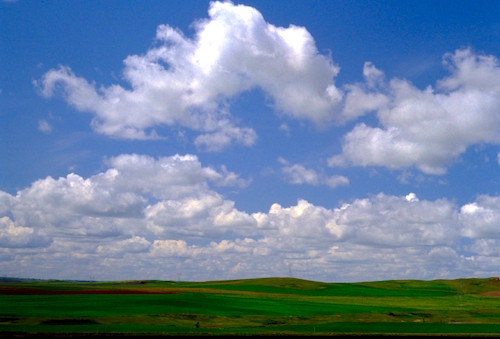
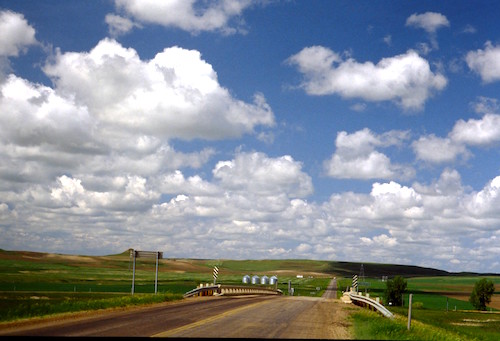
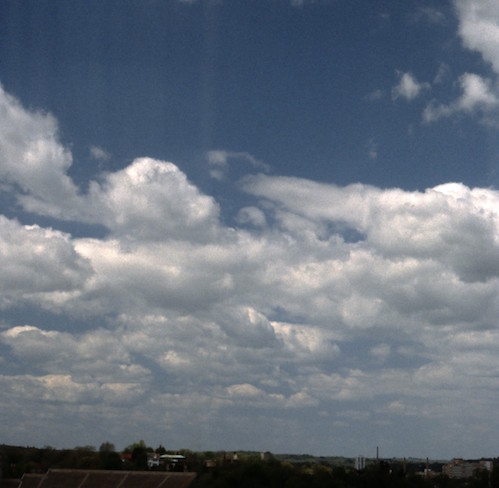
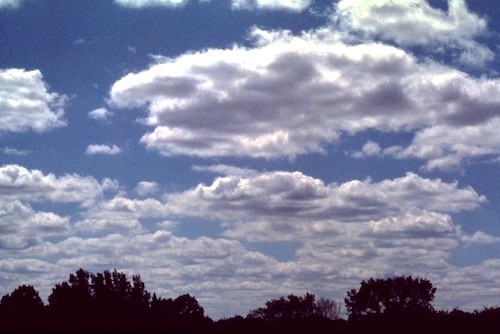
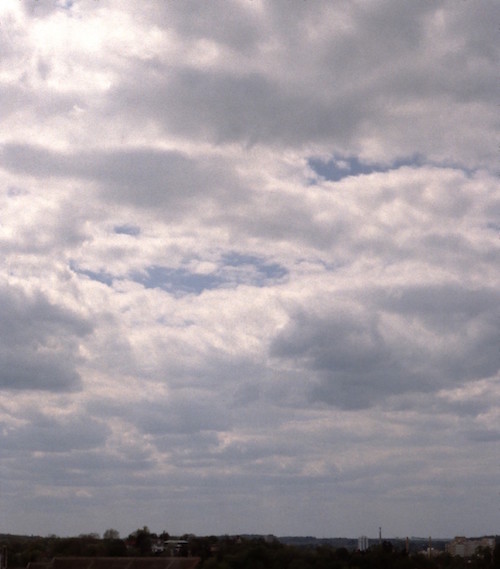
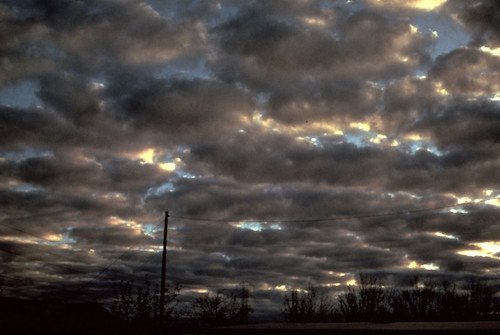
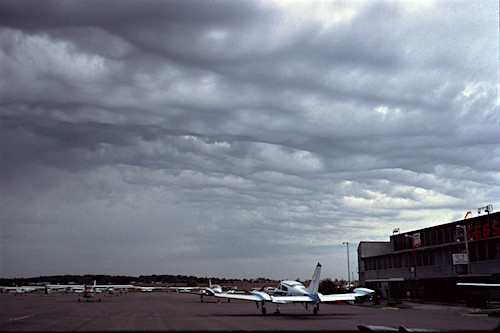
The photos below show different cloud coverages as viewed from the ground. Note that all of these photos were taken at oblique angles, so when you look through the clear spaces between the clouds, you can see the vertical sides of the next clouds behind the clear space. Hence, the cloudiness looks greater than it actually is.
Cloud Coverage |
Examples |
| Sky Clear (SKC, 0/8 coverage) (except for a few clouds off in the distance) |
 |
| Few Clouds (FEW, 1/8 coverage) |
 |
| Few Clouds (FEW, 2/8 coverage) |
 |
| Scattered (SCT, 3/8 coverage) |
 |
| Scattered (SCT, 4/8 coverage) |
 |
| Broken (BKN, 5/8 coverage) |
 |
| Broken (BKN, 6/8 coverage) |
 |
| Broken — a few breaks between
the clouds (BKN, 7/8 coverage) |
 |
| Overcast (OVC, 8/8 coverage) |
 |
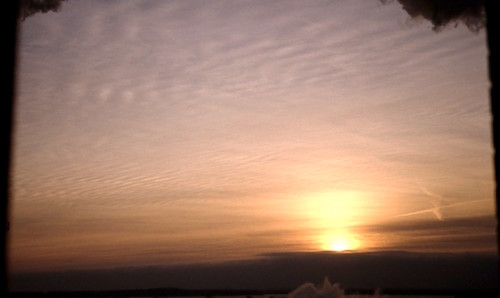
| Overcast (as reported by a human
observer) (OVC, 8/8 coverage) Clear below 12,000 feet (as reported by an automated weather station). (CLR) These are high cirrostratus clouds (see Learning Goal 1a). So even though this is nice flying weather with bright sunlight shining through the clouds, the sky is still completely covered with clouds. |
 |
How observers on the ground try to estimate sky cover by eye
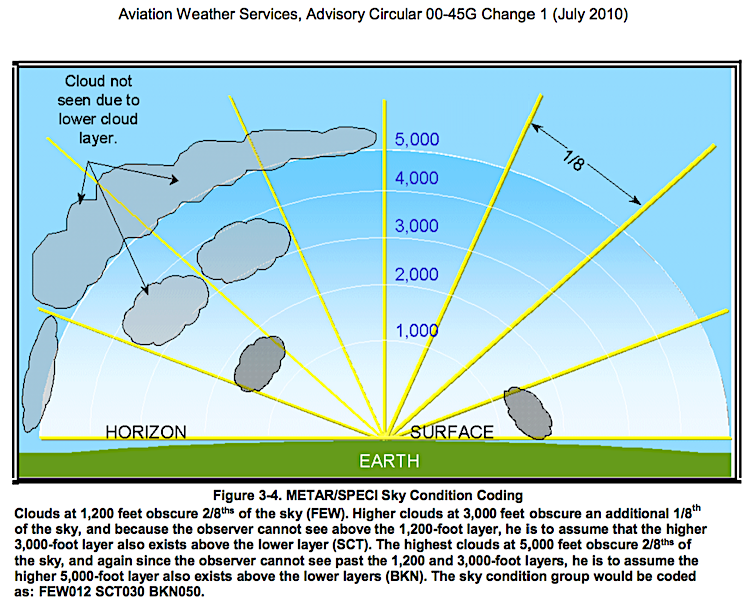
A tricky aspect of estimating cloud cover is that lower-altitude clouds block the view of higher-altitude clouds that might or might not really be there. To be conservative (i.e. extra safe), weather observers should always assume that if any clouds are visible at mid or higher levels, then clouds at those same levels are assumed to exist even if they are hidden by lower-altitude clouds.
This procedure is sketched in Figure 3-4 (taken from an FAA Advisory Circular publication), which describes how to describe (i.e., code) the cloud cover based on your observations. It is somewhat confusing at first. Read the figure caption carefully, and compare the cloud coverage amounts listed there (FEW, SCT, BKN) to the view in the sketch. The yellow lines in the sketch divide the sky into eight sectors, to enable cloud coverage to be reported in oktas. In real life, weather observers would make a similar division to the whole hemisphere of sky (i.e. in 3-D), not just to the semicircle of sky as sketched in 2-D.
Also, the white arc in Figure 3-4 represents altitudes (feet), and this assumes that the weather observer can correctly measure or estimate the altitudes. While vertically pointing ceilometers can give accurate cloud base directly over the airport, there are no accurate measures off-vertical, unless pilots coming in to land or taking off radio in pilot reports (PIREPs) of cloud base heights. As discussed in Learning Goal 1d, unfortunately, cloud height estimates by eye are rarely accurate.
Caution interpreting that figure. Notice that the sketch seems to show two clouds touching the surface. But that is NOT really the case. The "surface" is at only one point — the point where all the yellow lines converge. Any clouds not at that point are actually at some height above the surface. For example, the cloud in the sketch to the right of the word "SURFACE" is a cloud that the observer see by looking to the right, but for which this cloud has a cloud base (bottom of the cloud) at 1000 feet AGL (above ground level).
With this conservative method, weather observers always never underestimate the cloud coverage, but often overestimate the coverage. So when cloud "observations" are reported, such as in a Meteorological Aviation Report (METAR), the actual cloud coverage might not be as bad as reported. But you cannot count on this always being the case.
My personal approach when planning a flight is to "go look and see", but always with a safety net. Namely, I might try to fly VFR to a location with an "observed" low ceiling, in the hopes that it is not really that bad. While flying toward that location, I believe what I see out the windscreen, not what was "observed" or forecast. But I always have an alternate plan in case the ceiling is as bad as forecast. The alternative could be turning back or landing at an alternate airport where weather conditions are forecast to be very good for VFR flight. Or, in my case, as an instrument pilot and flight instructor, getting the appropriate IFR clearance to fly through the clouds if needed.
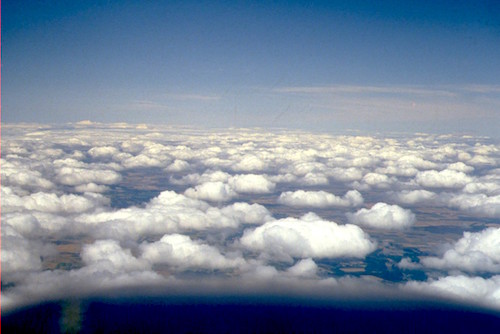
Cloud coverage as viewed from an aircraft
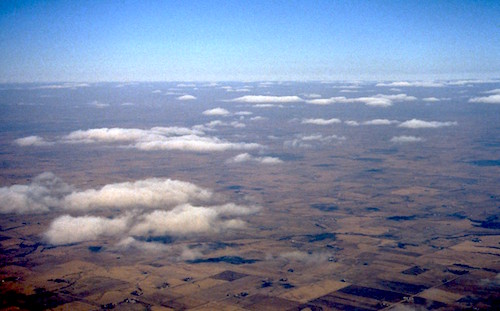
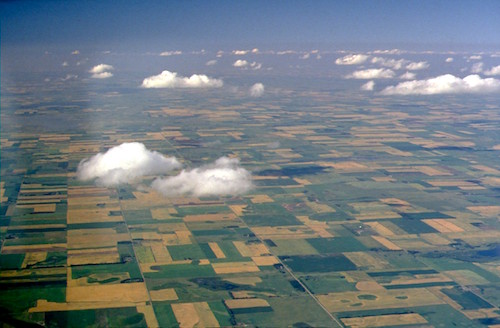
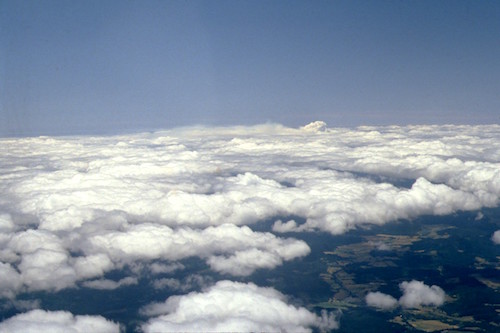
The advantage while flying over or under clouds is that you can keep track of the clouds and clear spaces as you fly. So by looking vertically, you can create a fairly accurate estimate of cloud cover. Also, if the sun is fairly high in the sky, you can look toward the ground to see what fraction of the ground is covered by shadows of clouds, as shown in the figure below.
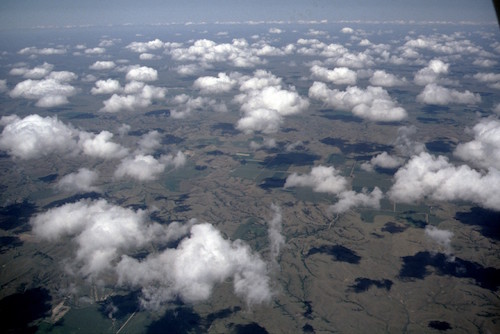
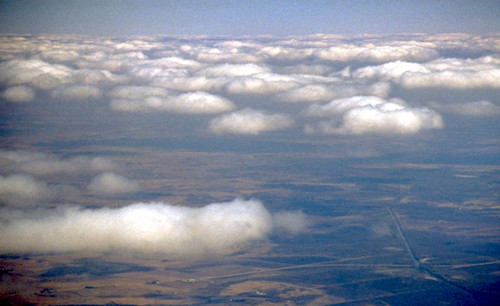
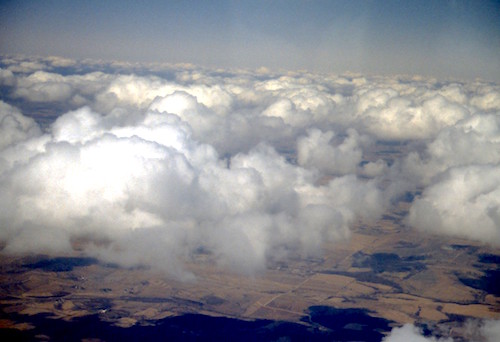
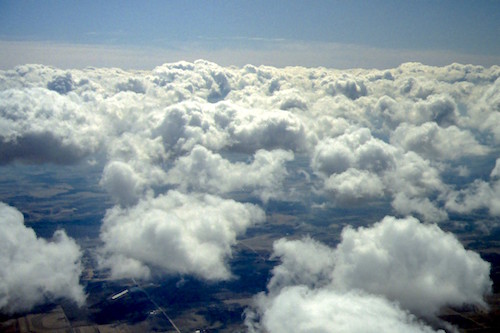
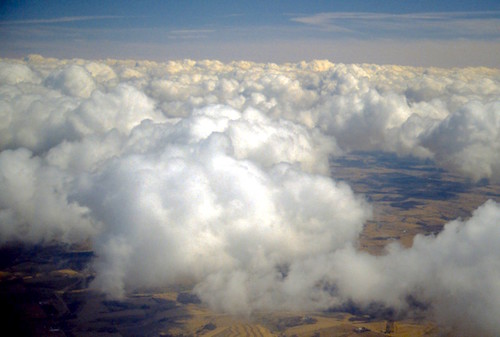
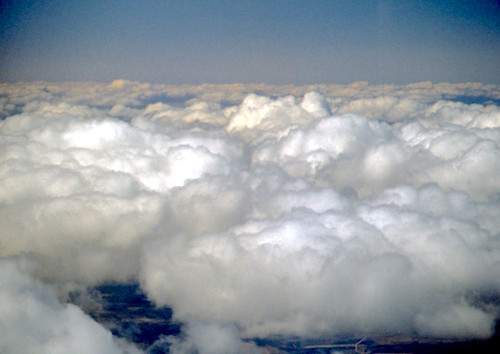
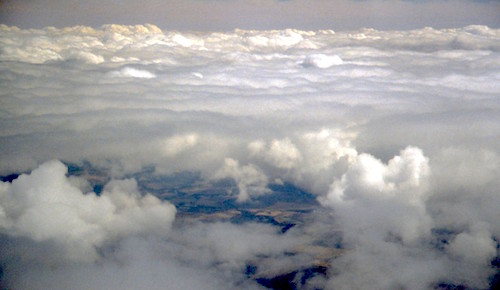
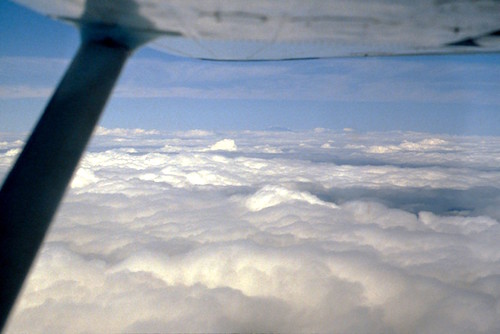
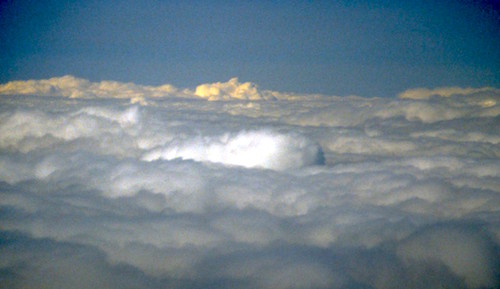
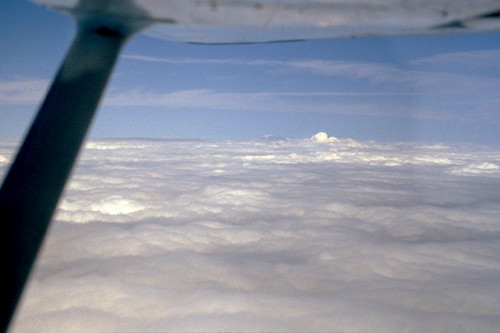
Caution: If you are flying at an altitude just above or just below the clouds, then in your slant or oblique view, the sky will look much more overcast than it really is. The reason is that with an oblique view, the vertical body of the cloud blocks your view of clear spaces horizontally hidden behind the cloud. Most of the photos below look like greater cloud coverage than they actually are.
Below are photos I took of different cloud coverages. All photos are oblique views, so the actual coverage is less than it looks.
Cloud coverage |
Example 1 |
Example 2 |
| Few Clouds (FEW, 1/8 coverage) |
 |
 |
| Few Clouds (FEW, 2/8 coverage) |
 |
(no photo) |
| Scattered (SCT, 3/8 coverage) |
 |
 |
| Scattered (SCT, 4/8 coverage) |
 |
(no photo) |
| Broken (BKN, 5/8 coverage, or perhaps SCT 4/8) |
 |
(no photo) |
| Broken (BKN, 6/8 coverage) |
 |
 |
| Broken — a few breaks between
the clouds (BKN, 7/8 coverage) |
 |
 |
| Overcast (OVC, 8/8 coverage) |
 |
 |
Key words: above ground level (AGL), broken,
ceiling, cloud amount, cloud cover, IFR, METARs, obscured, oktas,
overcast, sky cover, vertical visibility, VFR, WMO, cirrostratus
Extra info for Experts; Not Needed for this Course.
- An excellent USA user's guide: Aviation Weather Services, Advisory Circular, AC 00-45H — available for free as a PDF from the FAA, 427 pages. It is updated every several years or so. The Nov 2016 edition is valid at the time of this writing (Sep 2018). See section 3.1.5.9 for cloud coverage.
Every US pilot should get a copy, because it explains how to interpret text products (METARs, PIREPs, TAFs, FAs, etc.), graphics products (including analysis and forecast charts, radar and satellite images), aviation hazards products (SIGMETs, AIRMETs, tropical cyclone and volcanic ash advisories, SIGWXs, icing and turbulence potential), and much more. You can also buy printed copies of this advisory from online retailers.- Federal Meteorological Handbook No. 1 (2017), Chapter 9 on clouds.
- Canadian Aviation Weather Services Guide from NavCanada.
Image credits. All figures by Roland Stull, except the following: Figure 3-4. METAR/SPECI Sky Condition Coding. Aviation Weather Services, Advisory Circular 00-45H, (Nov 2016), page 3-16 (PDF page 44).