| |
Related documentation:
| DCIP2D user interface | data viewer | model maker | model viewer | tutorial |
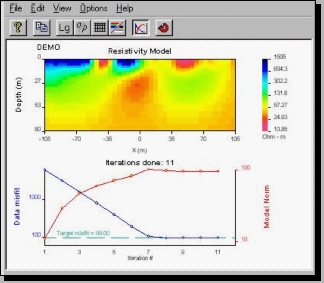 This program displays models of the earth recovered by the inversion process, and optionally a graph of the convergence behaviour of the process. The image can be manipulated, or copied, but there are no options for editing these results. This program displays models of the earth recovered by the inversion process, and optionally a graph of the convergence behaviour of the process. The image can be manipulated, or copied, but there are no options for editing these results.
Starting this program
- Start by clicking the "model" button in the tool bar of the DCINV2D program. This is possible any time an inversion has been started, or after it has finished.
- This model plotting program can also be started separately to examine old results. Use the File menu Open ... option to identify the model and the associated "mesh" file, which defines the geometry of subsurface cells that make up the model.
- If "dcip2d-model-viewer.exe" is run from the command line with no parameters (or by double clicking it's icon) it will open directly with a blank window. However, a model can be loaded directly using the following command line parameters:
dcip2d-model-viewer mesh.msh model.mod /ip /conv
mesh.msh is any mesh file
model.mod is the corresponding model file.
/ip - plot chargeability model (otherwise plot conductivity model).
/conv - read the convergence curves from "dcinv2d.out" or "ipinv2d.out".
Menu functions
Most menu options are duplicated with buttons on the tool bar. Exceptions include
- The Options menu, Min/max ... function is used to adjust the range of values depicted by the colour scale. It is useful if need to compare several figures.
- The Options menu, Padding cells ... option strips off padding cells in the plot. It does nothing to the actual results; this is purely to enhance the image of the region investigated by the survey.
- The Options menu, Area of interest option will mask segments of the image outside a region that you specify, using survey coordinates.
-
 The Options menu, Depth of Investigation option requires a second inversion result using a different reference model. You specify the second model file and a DOI cut-off value, and the result will be a model with colours hatched below the specified cut-off range. The Options menu, Depth of Investigation option requires a second inversion result using a different reference model. You specify the second model file and a DOI cut-off value, and the result will be a model with colours hatched below the specified cut-off range.
Tool bar functions
- The Copy, Log10, / , and colour/BW buttons are all identical to those in the data plotting program.
- The Mesh button is a toggle to display or remove black lines that outline the model's cells. It is useful for determining padding cells.
- The Convergence curves button adds a graph of data misfit and model norm versus iteration. This helps you see whether the inversion was well behaved. The button is only active if an inversion was completed in the "active" directory.
- The Reload button can be clicked if the inversion process is still under way, and you are viewing intermediate results.
- If you click and hold the left mouse button while pointing to the model itself, the X and Z location of the mouse pointer will be displayed in the bottom status line of the window.
NOTE: there are no zoom buttons because the plot size changes if you re-size the window. Use this feature to make figures a sensible size before copying to the clipboard for pasting into a document.
|
|
