News
Stay up-to-date with what's happening in EOAS
How much water is stored in the subducting mantle? - Wasja Bloch
Do you know how to estimate the amount of hydration of the subducting oceanic mantle? Watch our interview with EOAS seismologist Wasja Bloch to find out!
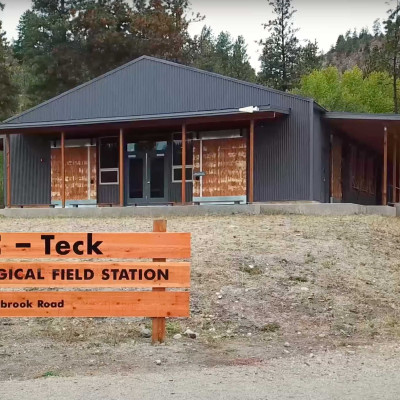
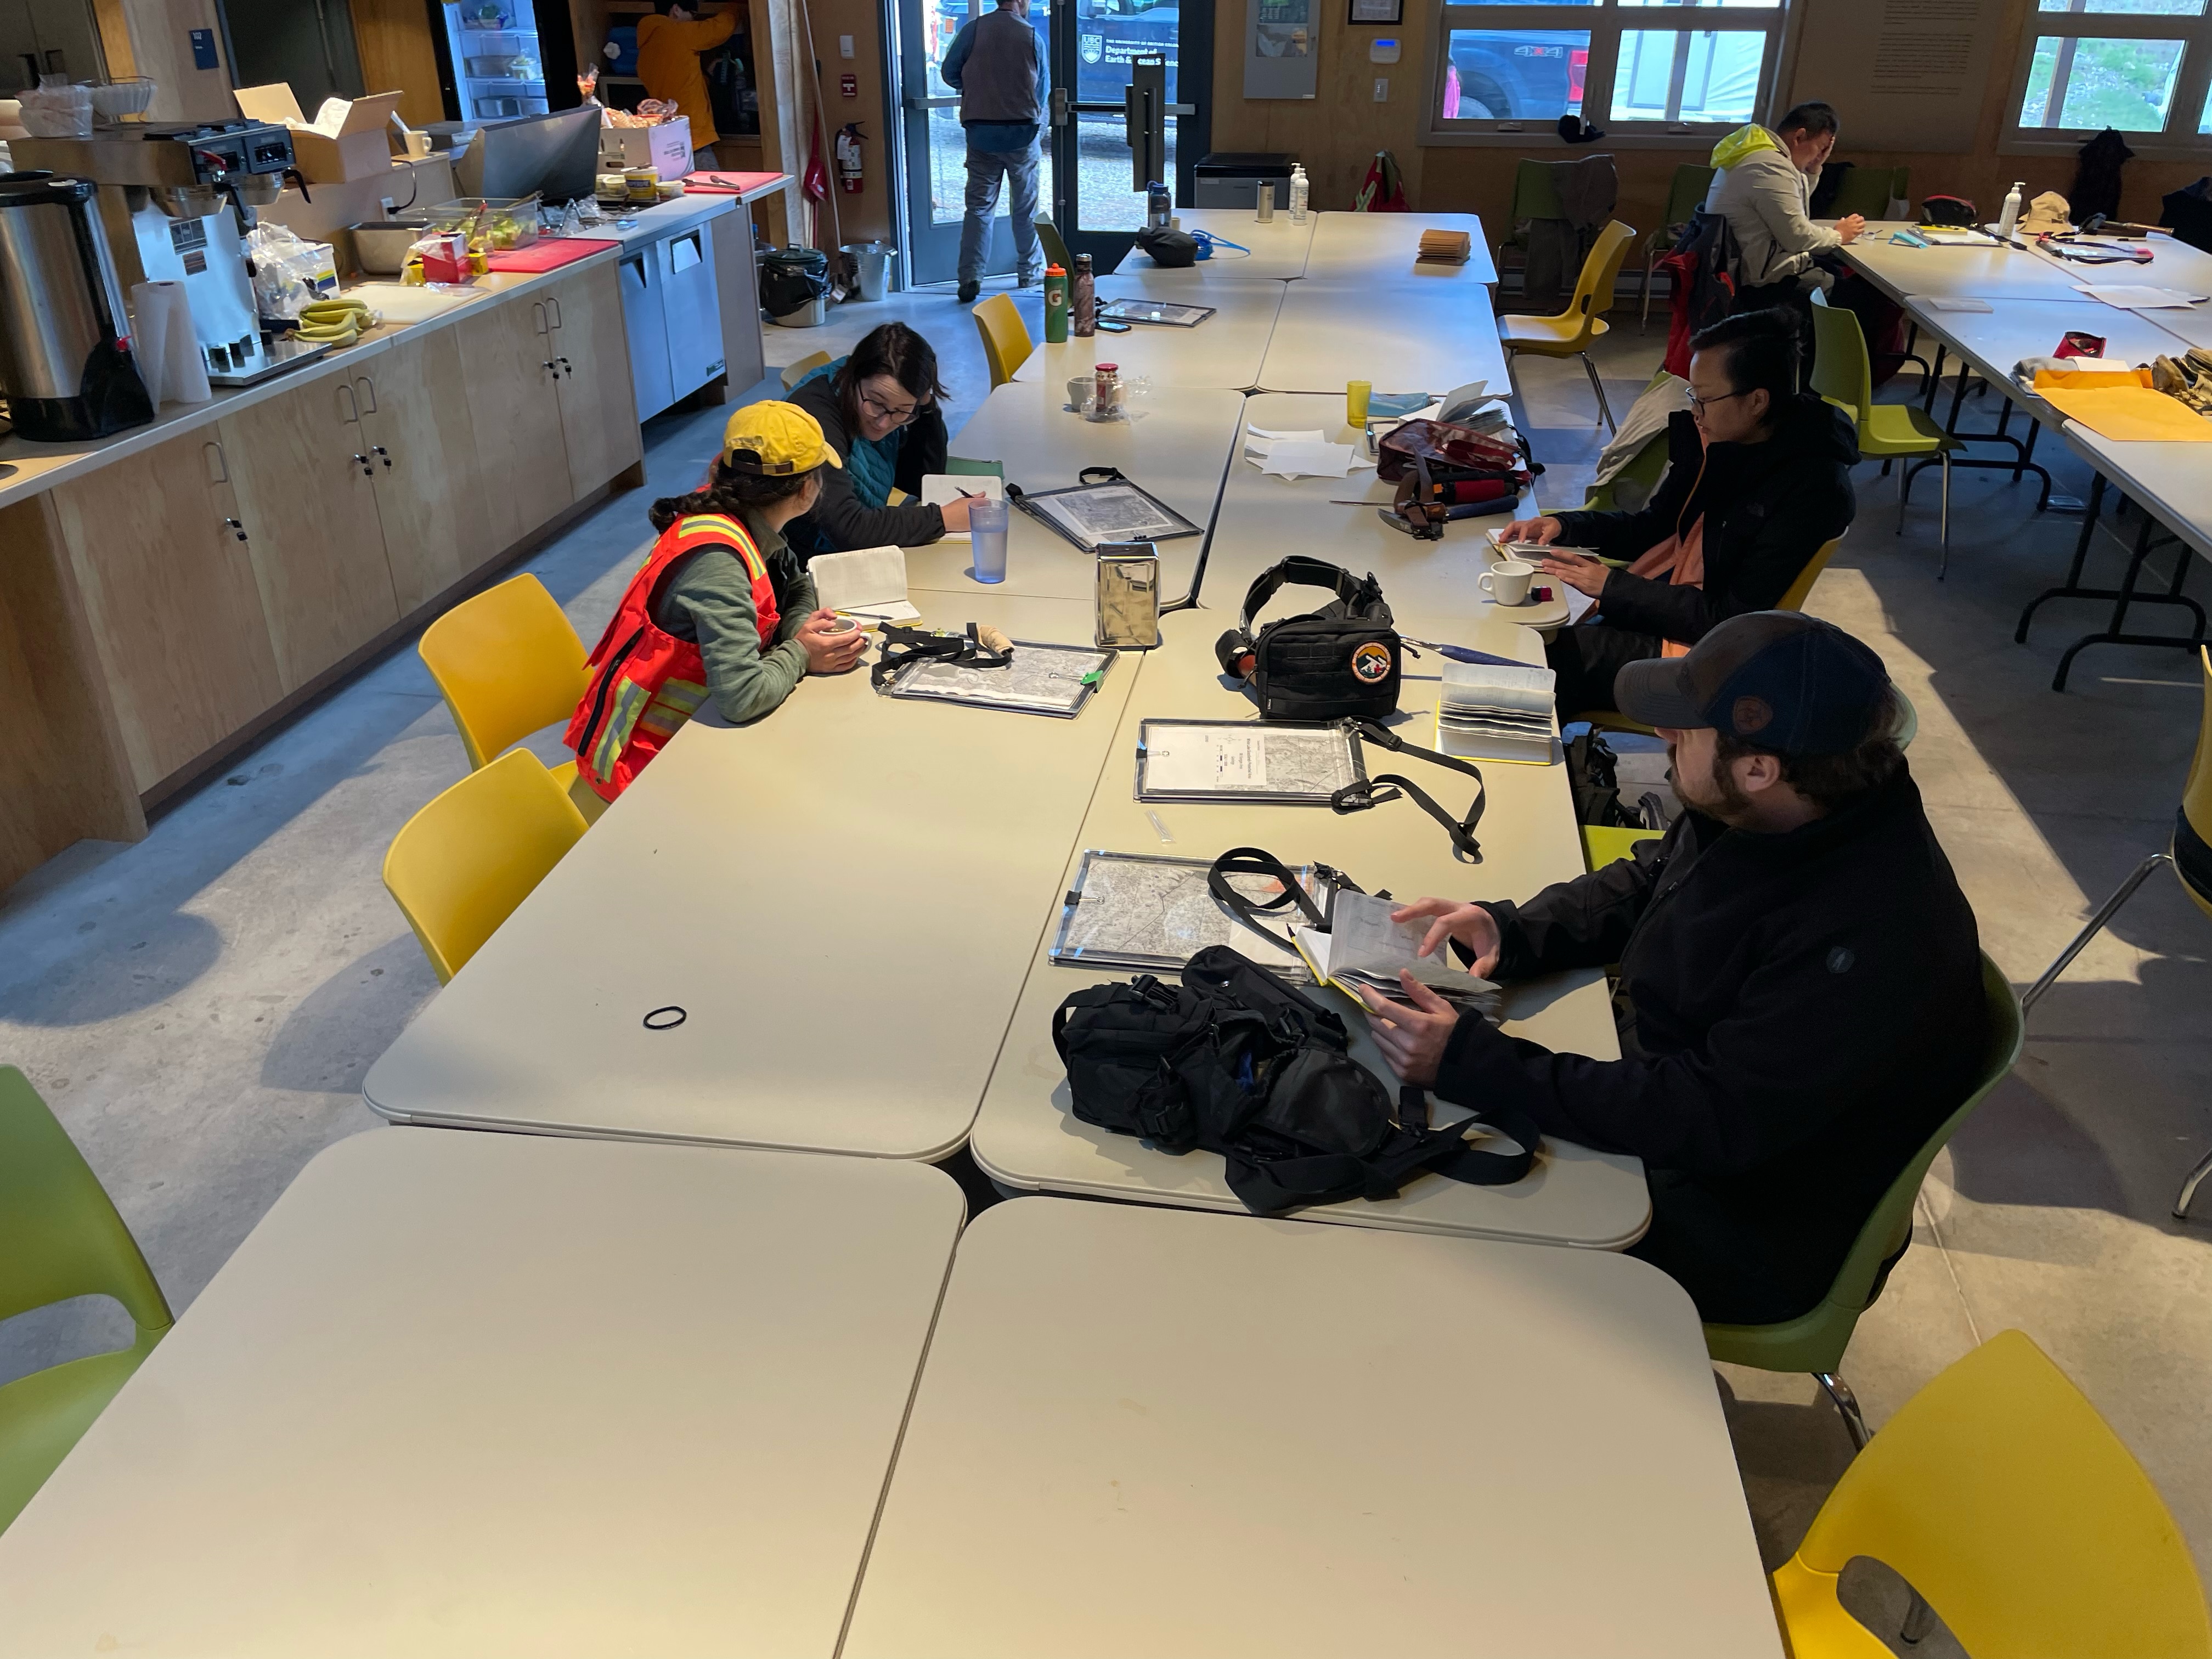
UBC unveils $2.4-million expansion of geology field school in south Okanagan
Since the 1950s, UBC students have been making the annual trek to Oliver, B.C. for geological field school. Thanks to $2.4 million in contributions from UBC Science alumni, friends, and Teck Resources Limited, this year's field school looks a little different. UBC Science and the EOAS department are proud to announce that students, researchers, and community groups are now welcome at the updated and expanded geology field station.
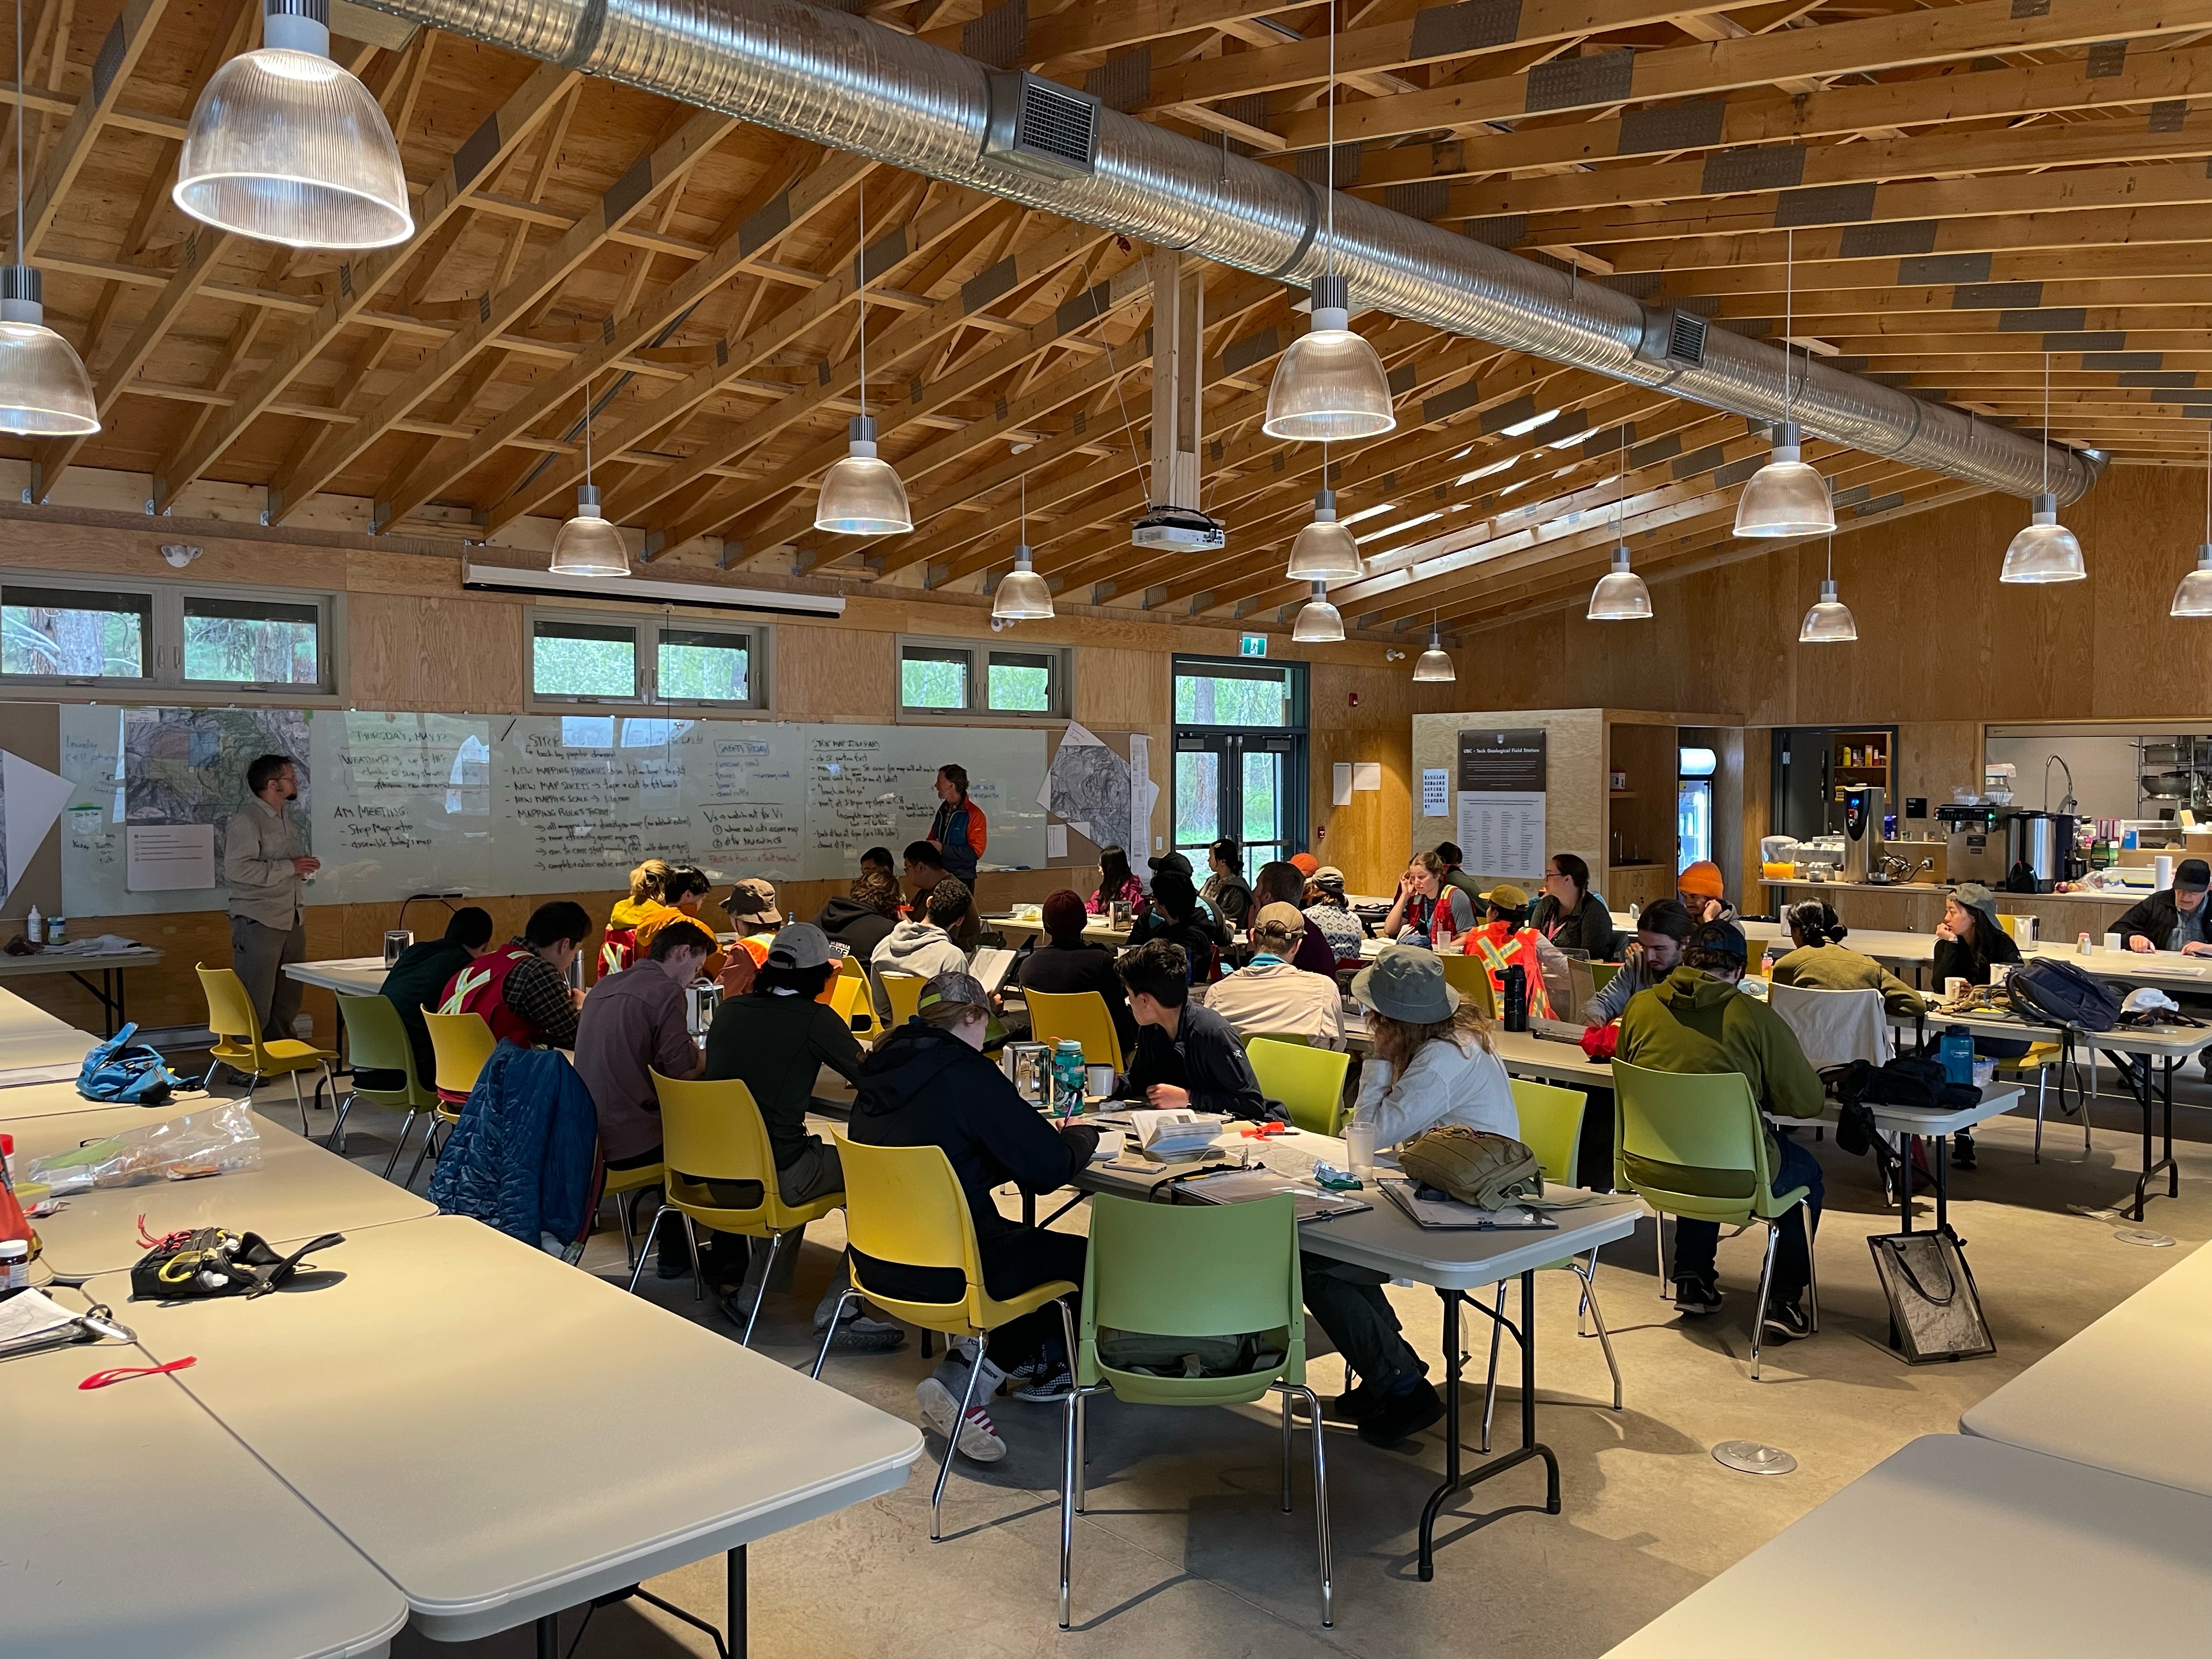
New staff and student accommodations, as well as a new 4,3000 square foot teaching facility, were made possible by a $1 million donation from Teck. 200 UBC alumi, donors, and friends also contributed to the cause. The new facilities will be used by UBC geology, earth science and geological engineering students to gain critical field skills and serve as a valuable new resource for other research and community groups in the south Okanagan.
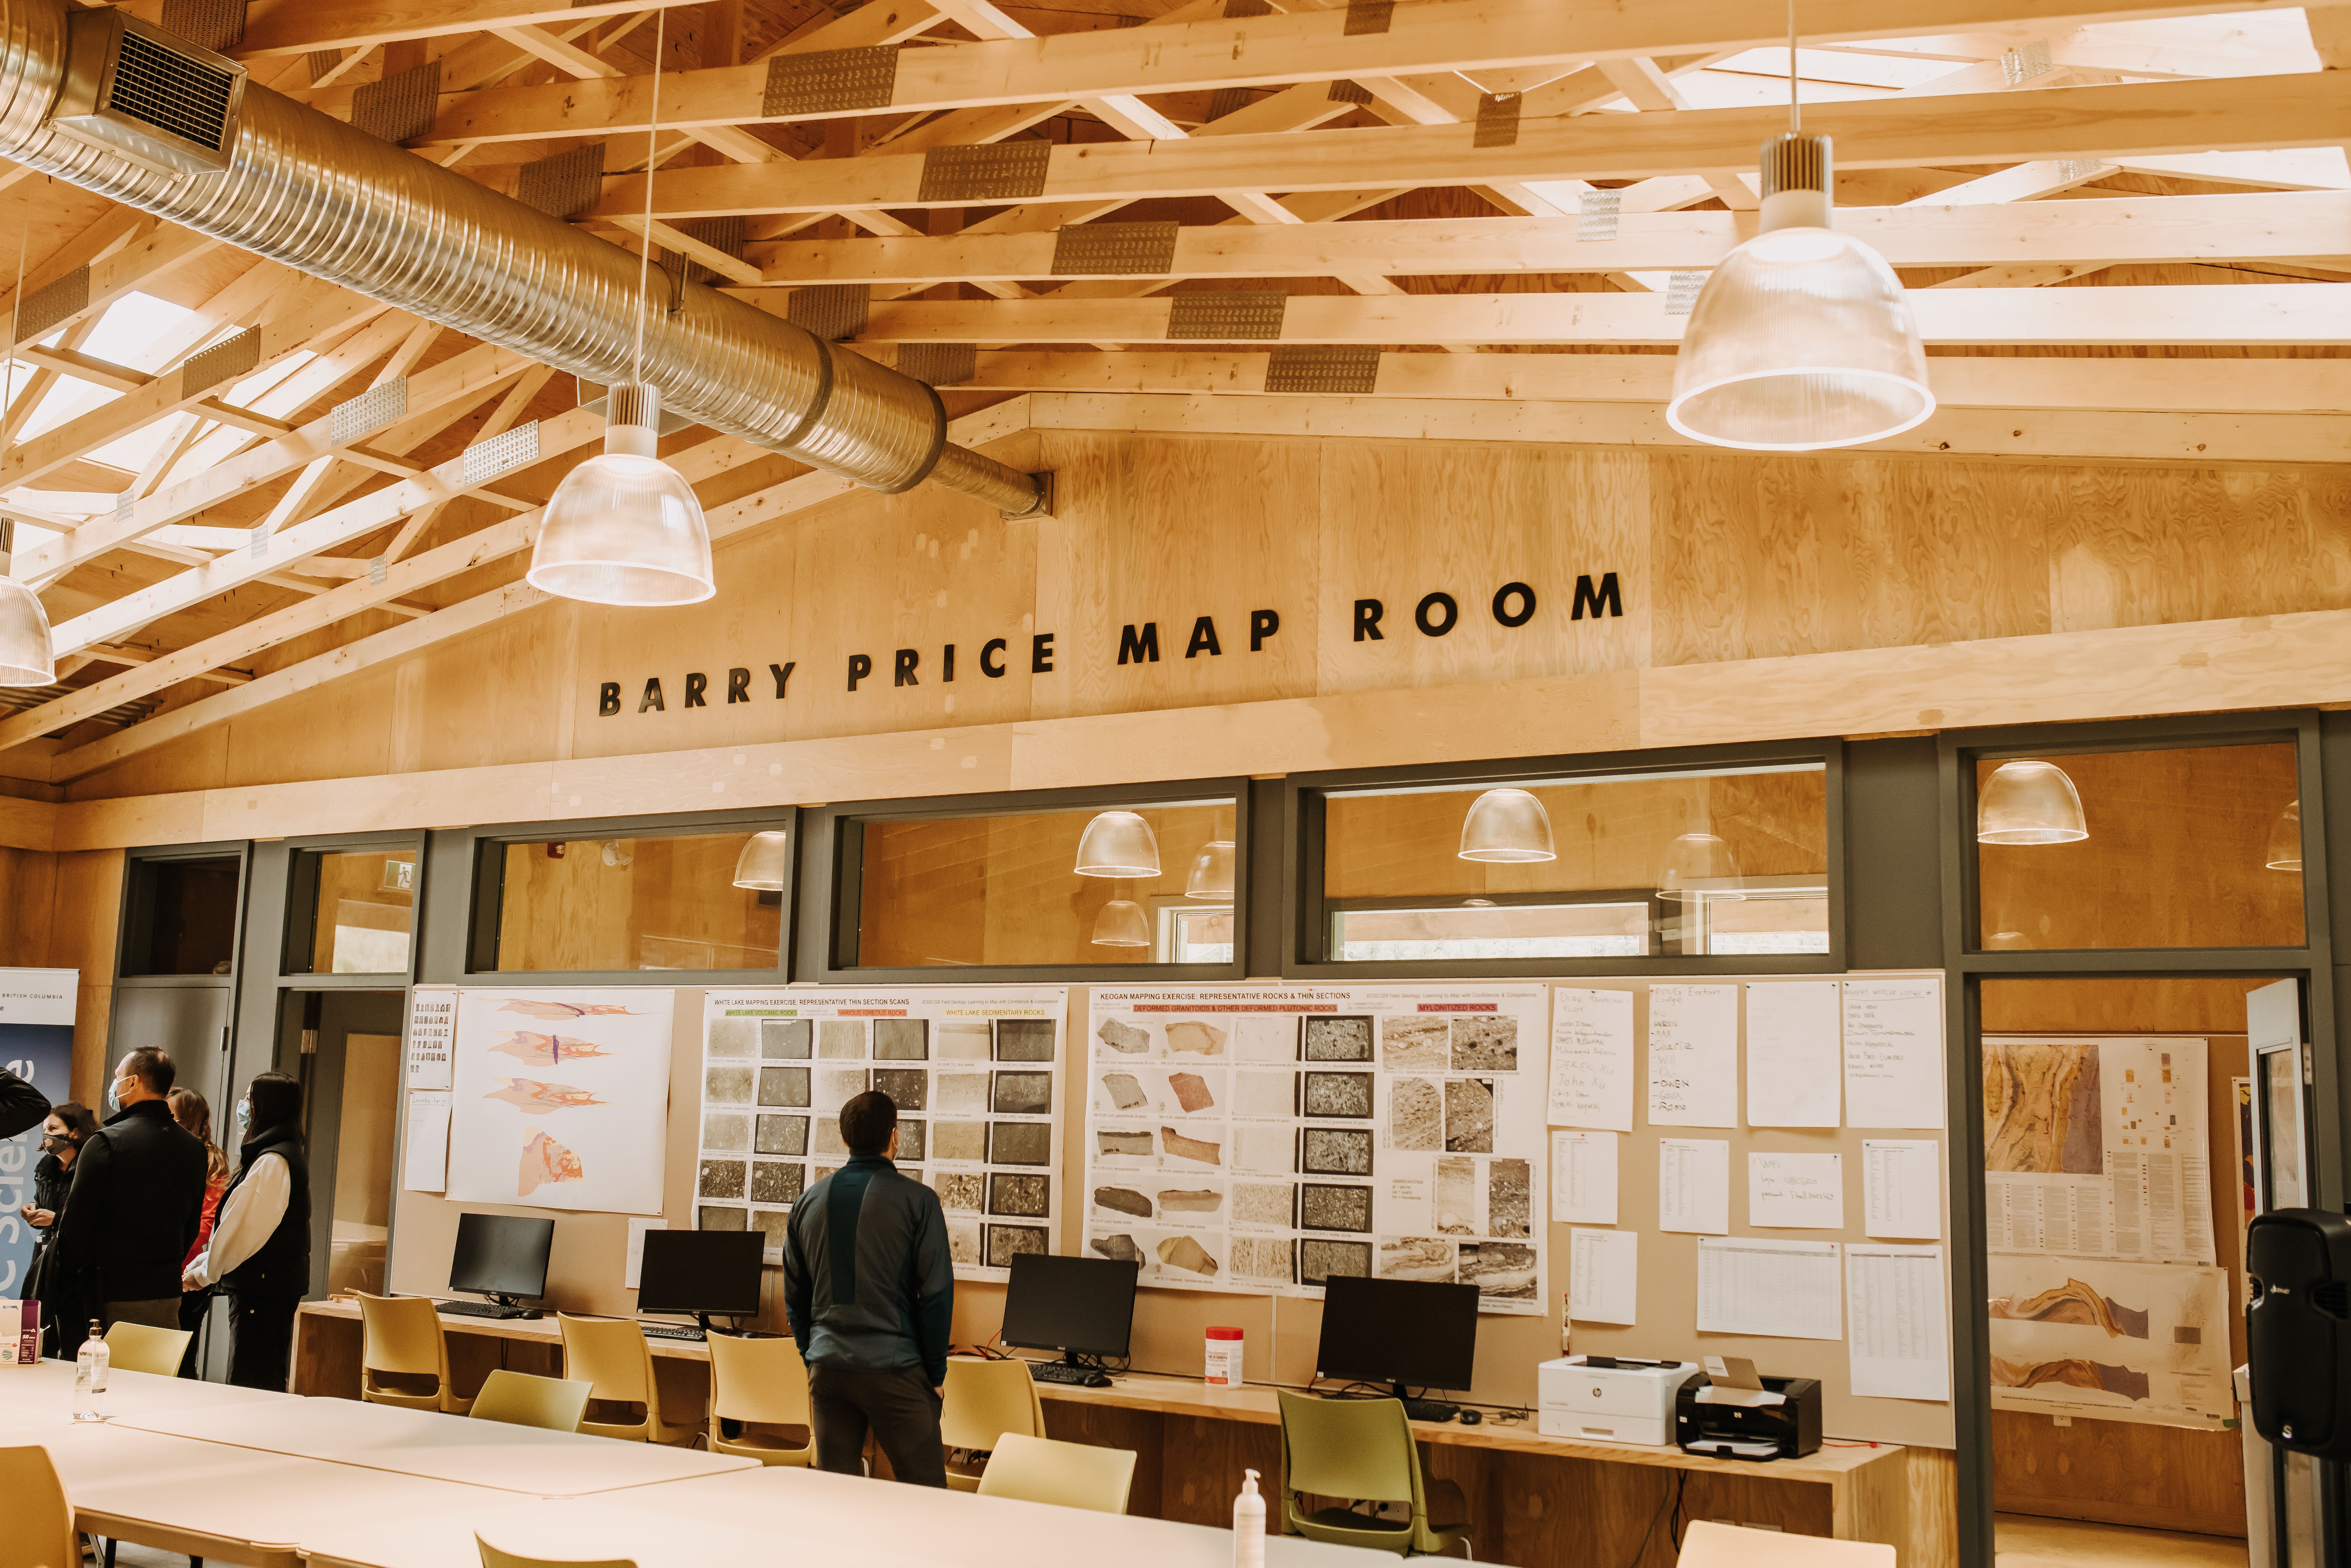
Professor Ken Hickey, who teaches the senior field school, shares more details about the new facilities here.

EOAS faculty members participate in NASA's OSIRIS-REx mission
Dr. Dominique Weis and Dr. Catherine Johnson
The Canadian Space Agency (CSA) has recently publicized Canadian institutes that will be working on NASA’s OSIRIS-REx project, a prestigious endeavor to analyze samples of the asteroid Bennu, which marks Canada's first participation in an asteroid sample return. UBC EOAS faculty members Dr. Dominique Weis and Dr. Catherine Johnson will lead their teams to participate in this mission.
Canada has contributed technical and scientific expertise to the OSIRIS-REx mission (click here to learn more). The CSA provides OLA (OSIRIS-REx Laser Altimeter), a lidar system able to scan the asteroid from up to 7 km away, and supports scientists and engineers on OLA's development and operations team. In exchange for providing the OLA instrument to the mission, the CSA will own 4% of the total returned sample, thus providing Canada's scientific community with its first-ever direct access to a returned asteroid sample. Researchers from around the country were selected to perform investigations that will help unravel Bennu's physical, chemical, and geological mysteries, after the sample arrival on Earth in 2023. As part of the broader OSIRIS-REx science team, Dr. Weis’ team will analyze the sample to determine its origin and history. Dr. Johnson's team has been involved in the mission for over a decade, analyzing data collected by OLA to help determine the shape of the asteroid, as well as select and characterize the sample site.
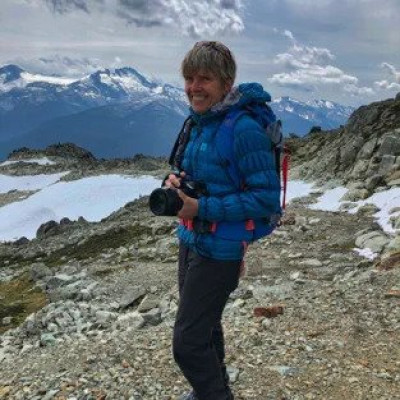
Meet Dr. Dominique Weis - Geochemist
Dominique Weis is a leader in the innovative use of trace elements and isotope geochemistry, and is widely respected “for the elegance, precision and impact of her geochemical studies of the Earth from large igneous provinces to the environment." Specifically, her research aims to (1) improve our understanding of planetary evolution and the Earth’s environment, (2) model the geochemical and isotopic variations of the Earth’s mantle through a comparative study of large igneous provinces and more recent volcanic centres, and (3) determine the origin, source and pathways of mantle plumes, and their variations through time. As Director of the Pacific Centre for Isotopic and Geochemical Research, Dr. Weis is closely involved in the training of highly qualified personnel, and with industrial partners in the technology transfer and application of novel isotopic techniques for solving earth and environmental problems.
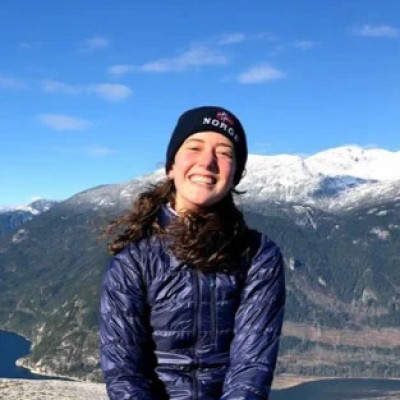
Meet Becca Beutel - Physical Oceanographer
Becca Beutel is a MSc student in Physical Oceanography at UBC, working with Dr. Susan Allen in the Mesoscale Ocean and Atmospheric Dynamics research group. She is looking into which water masses make up the flow into and out of the Salish Sea (the body of water between Vancouver Island and the BC and Washington Mainland) by applying water parcel tracking simulations to two ocean models. Knowing more about where the water is coming from, and how this changes throughout a year and between years, will help us figure out how this ecologically and economically important region will be impacted by a changing climate and help us figure out what we can do to protect it!
Becca completed her bachelor’s degree in environmental engineering at the University of Guelph, and did 20 months of coop throughout it to best narrow down what area she wanted to work in. She is passionate about lifelong learning and thinks that research is the ideal setting to achieve this!
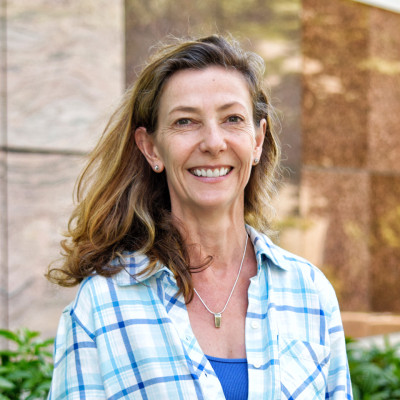
Dr. Catherine Johnson elected as a member of the American Academy of Arts & Sciences
Dr. Catherine Johnson, Planetary Scientist and Professor of Geophysics at EOAS, has been elected as a member of the American Academy of Arts and Sciences. With this election, Dr. Johnson joins the company of notable members, including Benjamin Franklin, Alexander Hamilton, George Washington, Margaret Mead, John F. Kennedy, Martin Luther King, Jr., Martha Graham, Georgia O’Keeffe, and Madeleine Albright.
Founded in 1780, the Academy honors excellence and convenes leaders from every field of human endeavor to examine new ideas, address issues of importance to the nation and the world, and work together, “to cultivate every art and science which may tend to advance the interest, honor, dignity, and happiness of a free, independent, and virtuous people.” The Academy’s work is wide-ranging and multidisciplinary, and its areas of focus include Arts & Humanities, Democracy & Justice, Education, Energy & Environment, Global Affairs, and Science & Technology. This year, 261 new members were elected to the Academy, representing today’s innovative thinkers in every field and profession.
Dr. Johnson was elected in Class I - Mathematical and Physical Sciences (Astronomy, Astrophysics and Earth Sciences). She researches geophysical investigations of terrestrial planets, moons and small bodies in our solar system, and has worked on several NASA planetary missions, including the Mars InSight mission and the Mercury MESSENGER mission. By using sample, observatory and satellite data, Dr. Johnson and her group probe the interior structure and history of these bodies to understand how internal and external processes interact to shape a planet or moon’s evolution. “Data are like puzzle pieces: If we collect them, look after them and query them carefully from many viewpoints, we can find and tell the stories of planets and moons.”
Check out Dr. Johnson’s website and this EOAS article to learn more about her group, research, teaching, and outreach.