News
Stay up-to-date with what's happening in EOAS

Earth Science Experiential and Indigenous Learning (EaSEIL): Reimagining, developing, and transforming field-based experiential learning opportunities for students
On April 11, the Earth Science Experiential and Indigenous Learning (EaSEIL) project held a hybrid Welcome and Orientation event for participants across departments and units within UBC. The event saw a highly engaged group of 25 individuals representing a diverse range of perspectives and prior experiences. Faculty members from the Departments of EOAS, Geography, Botany, and the Faculty of Forestry; representatives from UBC partner offices (CTLT Indigenous Initiatives; Office of Research Services UBC-O; Indigenous Research Support Initiative; and the Centre for Community Engaged Learning); and students joined EaSEILs leadership team at the event.
EaSEIL uses a “community of practice” model to reframe and transform teaching and practice around field-based experiential learning. The main feature of the Welcome and Orientation event was the launch of EaSEIL’s Community of Practice (CoP-A), which is "a professional learning experience where faculty, students and support offices contribute their expertise while enhancing their perspectives and teaching practice of field-based experiential opportunities. CoP-A’s work is anchored in collaborations amongst members as well as in individual and collective reflection about field-based learning across contexts”, said Silvia Mazabel, Lead Facilitator of CoP-A. Driven by CoP-A members’ individual goals for enhancing the learning experience of students in field-based courses, our partnership seeks to:
- Respectfully integrate Indigenous perspectives into course content,
- Increase accessibility and inclusion in field-based learning experiences,
- and integrate interdisciplinary and systems thinking approaches into field-based activities.
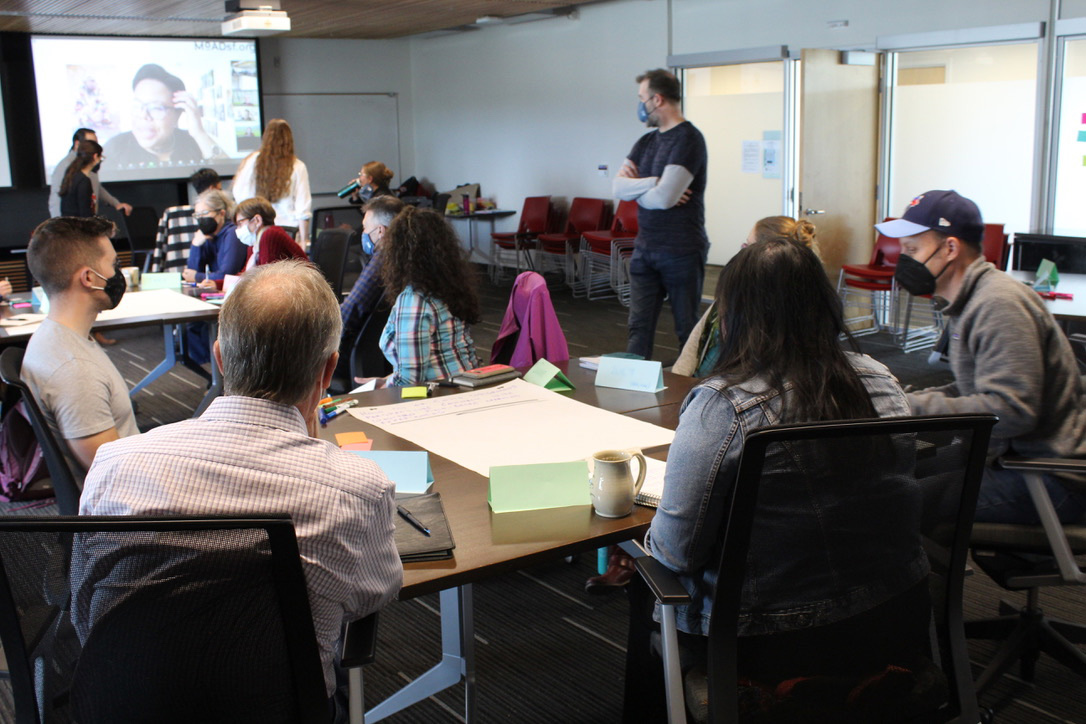
Photo: Daniel Gowryluk
This project brings together instructors’ disciplinary, teaching and contextual expertise, students’ perspectives on field-based courses, and knowledge/resources offered by UBC support offices. EOAS Department Head, Philippe Tortell, attended the event and commented: "We have a special opportunity to exchange knowledge and experience about field-based-learning courses across Earth science disciplines, while also integrating indigenous perspectives into our educational programs."
During the event, attendees had an opportunity to begin a conversation about various topics related to field-based learning. For example, they shared their perspectives about the role of virtual and augmented reality technologies in field-based learning opportunities, the connection between indigenous perspectives with western field-based learning experiences, and key learning objectives unique to field-based learning experiences. Although the activity was short, it was very productive!
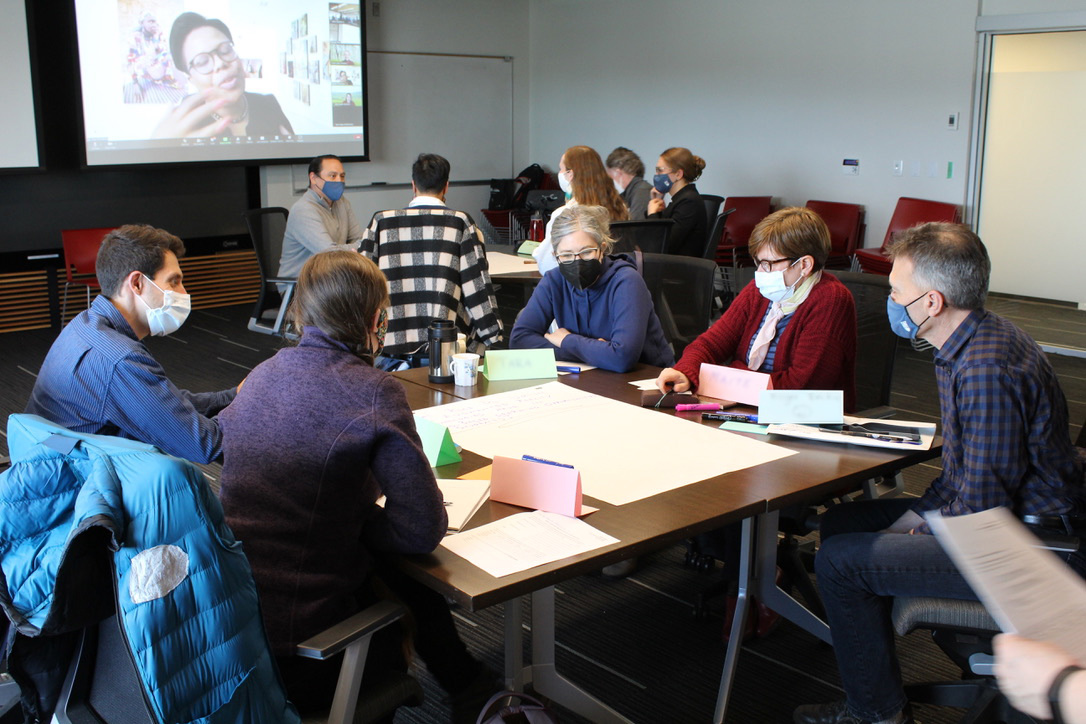
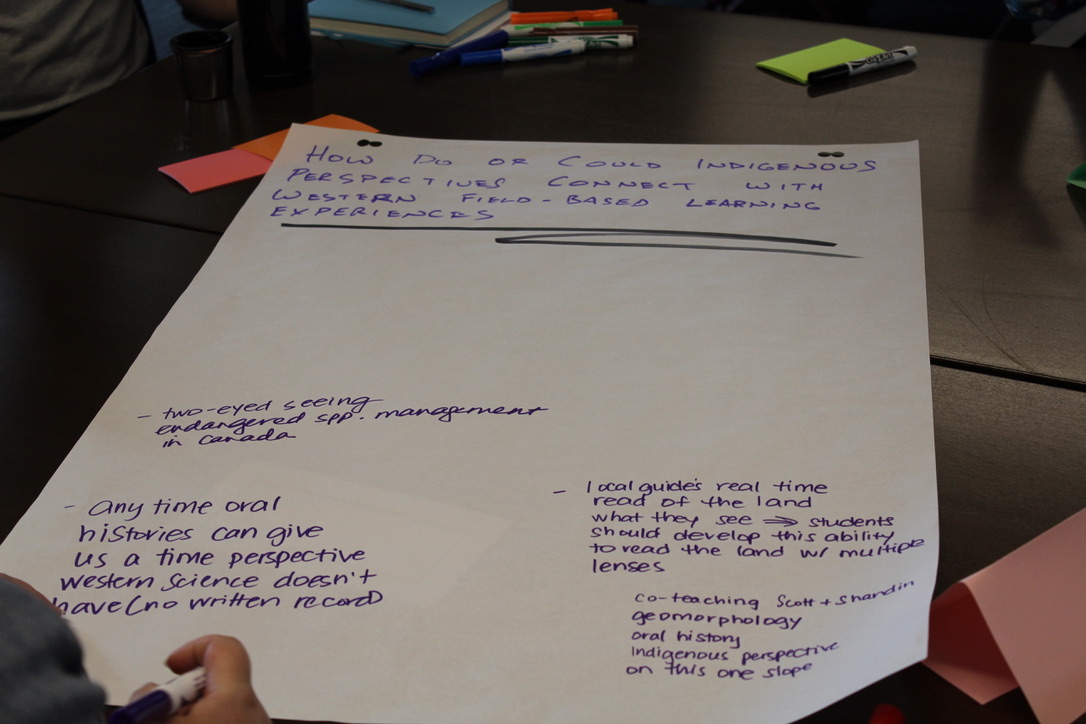
Photos: Daniel Gowryluk
EaSEIL is funded by UBC Teaching and Learning Enhancement Fund and led by Laura Lukes (Project lead & manager, research and evaluation), Shandin Pete (Project co-lead, place-based Indigenous communities’ partnerships), Silvia Mazabel (Lead Facilitator of Community of Practice, research and evaluation), Bean Sherman (Lead of Students as Partners and student community of practice), and Brett Gilley (Inclusion and accessibility).
Pacific Museum of Earth Joins National $6 Million Climate Change Project
As part of a $37.8 million Climate Action and Awareness Fund, the Government of Canada is investing $6 million toward a youth-focused climate change project, coined GenAction, led by science centres and museums across Canada.
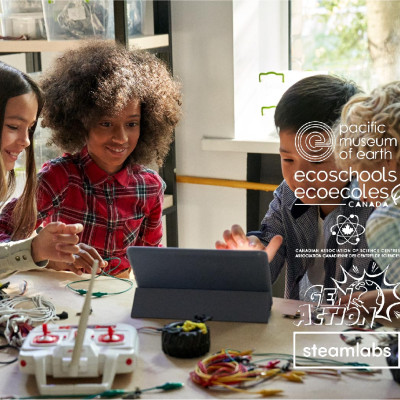
The Pacific Museum of Earth has joined 28 Canadian Association of Science Centres’ (CASC) members including GenAction project leaders, the Discovery Centre in Halifax, Nova Scotia, Science North in Sudbury, Ontario, and The Exploration Place in Prince George, British Columbia. The collective goal is to use the funds to create and deliver GenAction climate change engagement programs, targeting youth in every province and territory in Canada.
GenAction climate change programming, such as school programs, camps, outreach, and other hands-on locally relevant activities, aims to help youth understand current and credible climate change science, transform their thinking, and inspire them to take action. The goal of GenAction programming is to reach 200,000 kindergarten to grade 12 youth and more than 5,000 Indigenous youth in their communities, with a focus on affecting daily actions that will collectively contribute to the reduction of greenhouse gas emissions by 2050.
In addition, the Pacific Museum of Earth has partnered with Steamlabs.ca and ECOSchools Canada to create a Virtual Climate Escape Room.
With a reach of over 10 million visitors annually, CASC member science centres and museums play an important role in teaching youth to be critical thinkers and change makers on important issues like climate change. This contemporary immersive game format will synthesize the knowledge learned throughout the climate program and task groups to “escape” from climate change. Students will use critical-thinking and collaboration skills to solve a series of puzzles encoded in the room’s artifacts that communicate basic concepts of climate change/action in order to escape within a set period of time (45 - 60 minutes). Upon escaping from the game students will make a climate pledge for what climate action they will adopt in their daily life.
“we are thrilled to be a part of this national climate education movement" says the Museum's Director, Dr. Kirsten Hodge, "Our program will fill a critical piece in B.C’s K-12 science curriculum and will allow students to interact directly with climate scientists at UBC.”
Carbin Minerals founded by EOAS scientists wins $1 million from the Carbon Removal Xprize funded by the Musk Foundation
Greg Dipple, Bethany Ladd and Peter Scheuermann
“We unlock the enormous carbon dioxide removal potential of mine waste. Our technology will enable mines to become massive carbon sinks, while producing the metals needed to drive the clean energy transition.” – Carbin Minerals
UBC spin-off Carbin Minerals has won the $1million Milestone prize from the Carbon Removal Xprize, administered by the Musk Foundation.
Carbin Minerals have developed proprietary technologies to speed up the natural process of rocks absorbing CO2 from the air, cutting time from millennia to months. Working with mines, the company has committed to removing 1000 tonnes of atmospheric CO2 by 2024 and demonstrated a pathway to removing mega and giga tonnes in the future.
As Dipple said on CBC, being named as one of 15 winners out of an initial 1,133 entrants, all judged by a panel of 70 experts and scientists from across the globe, is a valuable endorsement for Carbin Minerals Inc. and its future. "It allows us to really accelerate our R&D and technology development and also the deployment of it. We're working hard right now to place this technology out in the field and start working."
The long-term goal of Carbin Minerals is to remove as much carbon dioxide from the atmosphere as possible, storing it safely and durably as rock, as Ladd said in a Q&A with UBC Science. “There is an enormous amount of carbon removal potential laying dormant in mine waste around the world, and it is only going to increase as the world’s demand for critical metals grows to supply the clean energy transition. We are working to unlock that potential so we can tangibly reduce the amount of carbon dioxide in our atmosphere and truly turn the dial on climate change.”
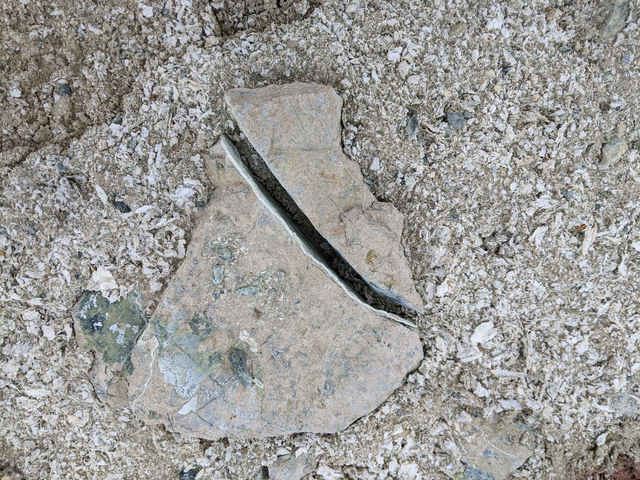
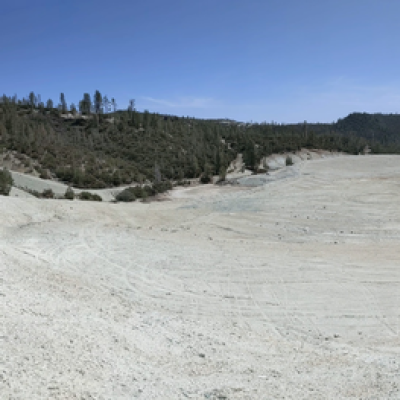
Rocks and materials at one of Carbin Minerals Inc.'s carbon removal research sites at a legacy mine located in the Western U.S. (photo: Bethany Ladd)
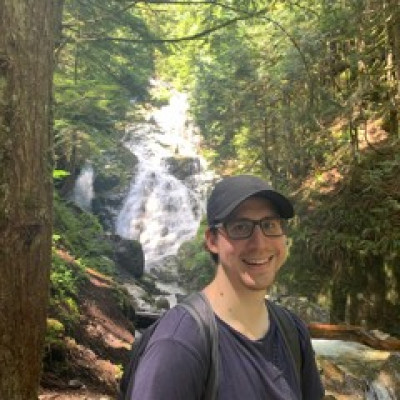
Meet Daniel Adria - Civil Engineer
Daniel Adria is a MASc student in Geological Engineering within the EOAS department at UBC, under Dr. Scott McDougall in the Geohazards Research Team. He is investigating tailings dam failures and their subsequent runout characteristics, to reduce uncertainties in risk assessments and emergency planning for mine projects and communities. Daniel completed his bachelor degree in civil engineering at UBC and worked in the consulting industry for a few years before returning to academia. When not modelling a tailings dam failure on a computer, Daniel can be often found outside, either skiing, sailing, or hiking throughout the south west coast of BC.
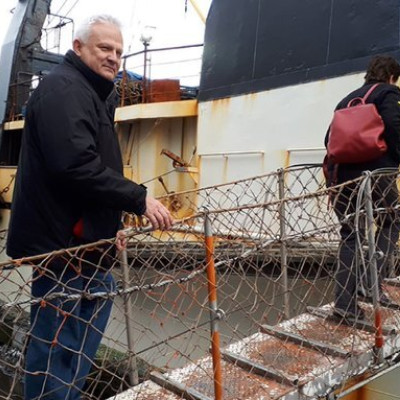
Dr. Evgeny Pakhomov aboard Russian research ship navigated uncertainty amid Ukraine invasion
The day after Russia invaded Ukraine, UBC Professor Evgeny Pakhomov (Institute for the Oceans and Fisheries, IOF and the Department of Earth, Ocean and Atmospheric Sciences, EOAS), chief scientist for the Pan-Pacific Winter High Seas Expedition, set sail on a Russian research vessel to study salmon in the North Pacific.
As a native Russian speaker with family in Ukraine, Dr. Pakhomov was onboard to take zooplankton, fish, and oceanographic samples and to train young Russian scientists. On day two, a message arrived that the ship was to return to Russia – the expedition was cancelled. Now, the question became just how to get Dr. Pakhomov and scientific samples home safely. Over the next three weeks, expedition organizers worked through multiple time zones and levels of bureaucracy to find a solution: Russian authorities were nervous about the ship entering American waters to drop him off, no ships would come to pick him up, and returning to Vladivostok would likely mean losing the majority of the collected samples – and Dr. Pakhomov entering a country at war. The only thing he could do was concentrate on getting the science done. Of the approximately 90 stations due to be sampled, the researchers managed to sample about 32, gathering valuable data for the more than a dozen projects involved.
Almost a week after he was due back, and just a few days before the ship would have to head back to Russia due to low fuel, a private company agreed to sail out of American waters to rendezvous with the Russian vessel, to the tune of about $16,000. In about 20 minutes, Dr. Pakhomov was onboard, with samples in tow, and soon back in Dutch Harbor, “I’ve never been so happy to step onto American soil.”
Listen to the CBC Radio Quirks and Quarks where Dr. Pakhomov shared his experience on board a Russian research ship amidst the Russo-Ukrainian War.
To learn more about how Dr. Pakhomov navigated uncertainty amid Ukraine invasion on board of the Russian research ship, read the article by The Globe and Mail.
Check out the IOF news article to learn more about the 2022 Salmon Pan-Pacific Winter High Seas Expedition.
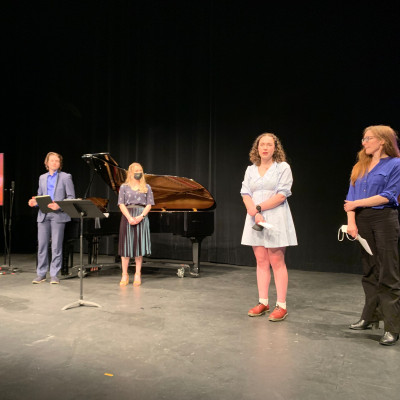
Sounds of Earth: EOAS scientists collaborate with the School of Music
For the past six months, members of the EOAS department have been working closely with UBC’s School of Music on the collaborative project, “Sounds of Earth”. Catalyzed by a visit from the quintet Axiom Brass in October 2021, graduate students and researchers came together with a student composer and group of student musicians to create a piece expressive of their research. For many, it was an entirely new way of communicating science.
“I’m used to communicating one on one with audiences, so this experience has definitely been different” says Ruth Moore, working with fellow scientist Rachel White and composer Ben Ledocohwski on a piece entitled “Three Degrees”. The pair’s collaboration garnered media coverage in national and local news outlets. Ruth, an MSc student, studies polar amplification and focuses on changes that global warming causes on the hydrological cycle in the Arctic. “Music is one of the most emotive art forms, in my opinion, and it has been really fun” she reflects “but also challenging, thinking of ways in which we can use music and science together to bring forward a message about climate change.”
Communicating through music helped some groups express the heightened stakes of climate affects like glacial retreat, as heard in “Glacial Suite”, a piece composed by Ashley Seward in collaboration with Serena Formenti and Christina Draeger. Other groups explored how the mechanics of music can express minutiae of the scientific process. The piece “Fragmenta” uses overlapping musical structures that move from disjointed disorder to joyful melody, representing the inversion processes that allows geophysicists to pull useful patterns from seemingly chaotic data. Joseph Cabriotti, who worked with the piece’s composer Mariah Mennie, notes that he was surprised to find that inversion is also a specific musical technique; “finding the common ground between these two seemingly unrelated fields made it easier to communicate ideas between them.”
Translating geological or atmospheric processes into the equally complex language of music proved an exciting challenge. Annie Borch and Henry Crawford, working with composer Athena Loredo, grappled with how to express the scale of geologic processes in their collaborative piece, “Tuya”. “Taking tens of thousands of years of glacial and volcanic history and condensing it into a six-minute piece is challenging” Annie reflected, “we wanted to accurately express that timescale, but make sure the piece still retained a compelling musical form.” The collaboration proved to be a great lesson in translating effectively between scientific constraints and musical conventions.
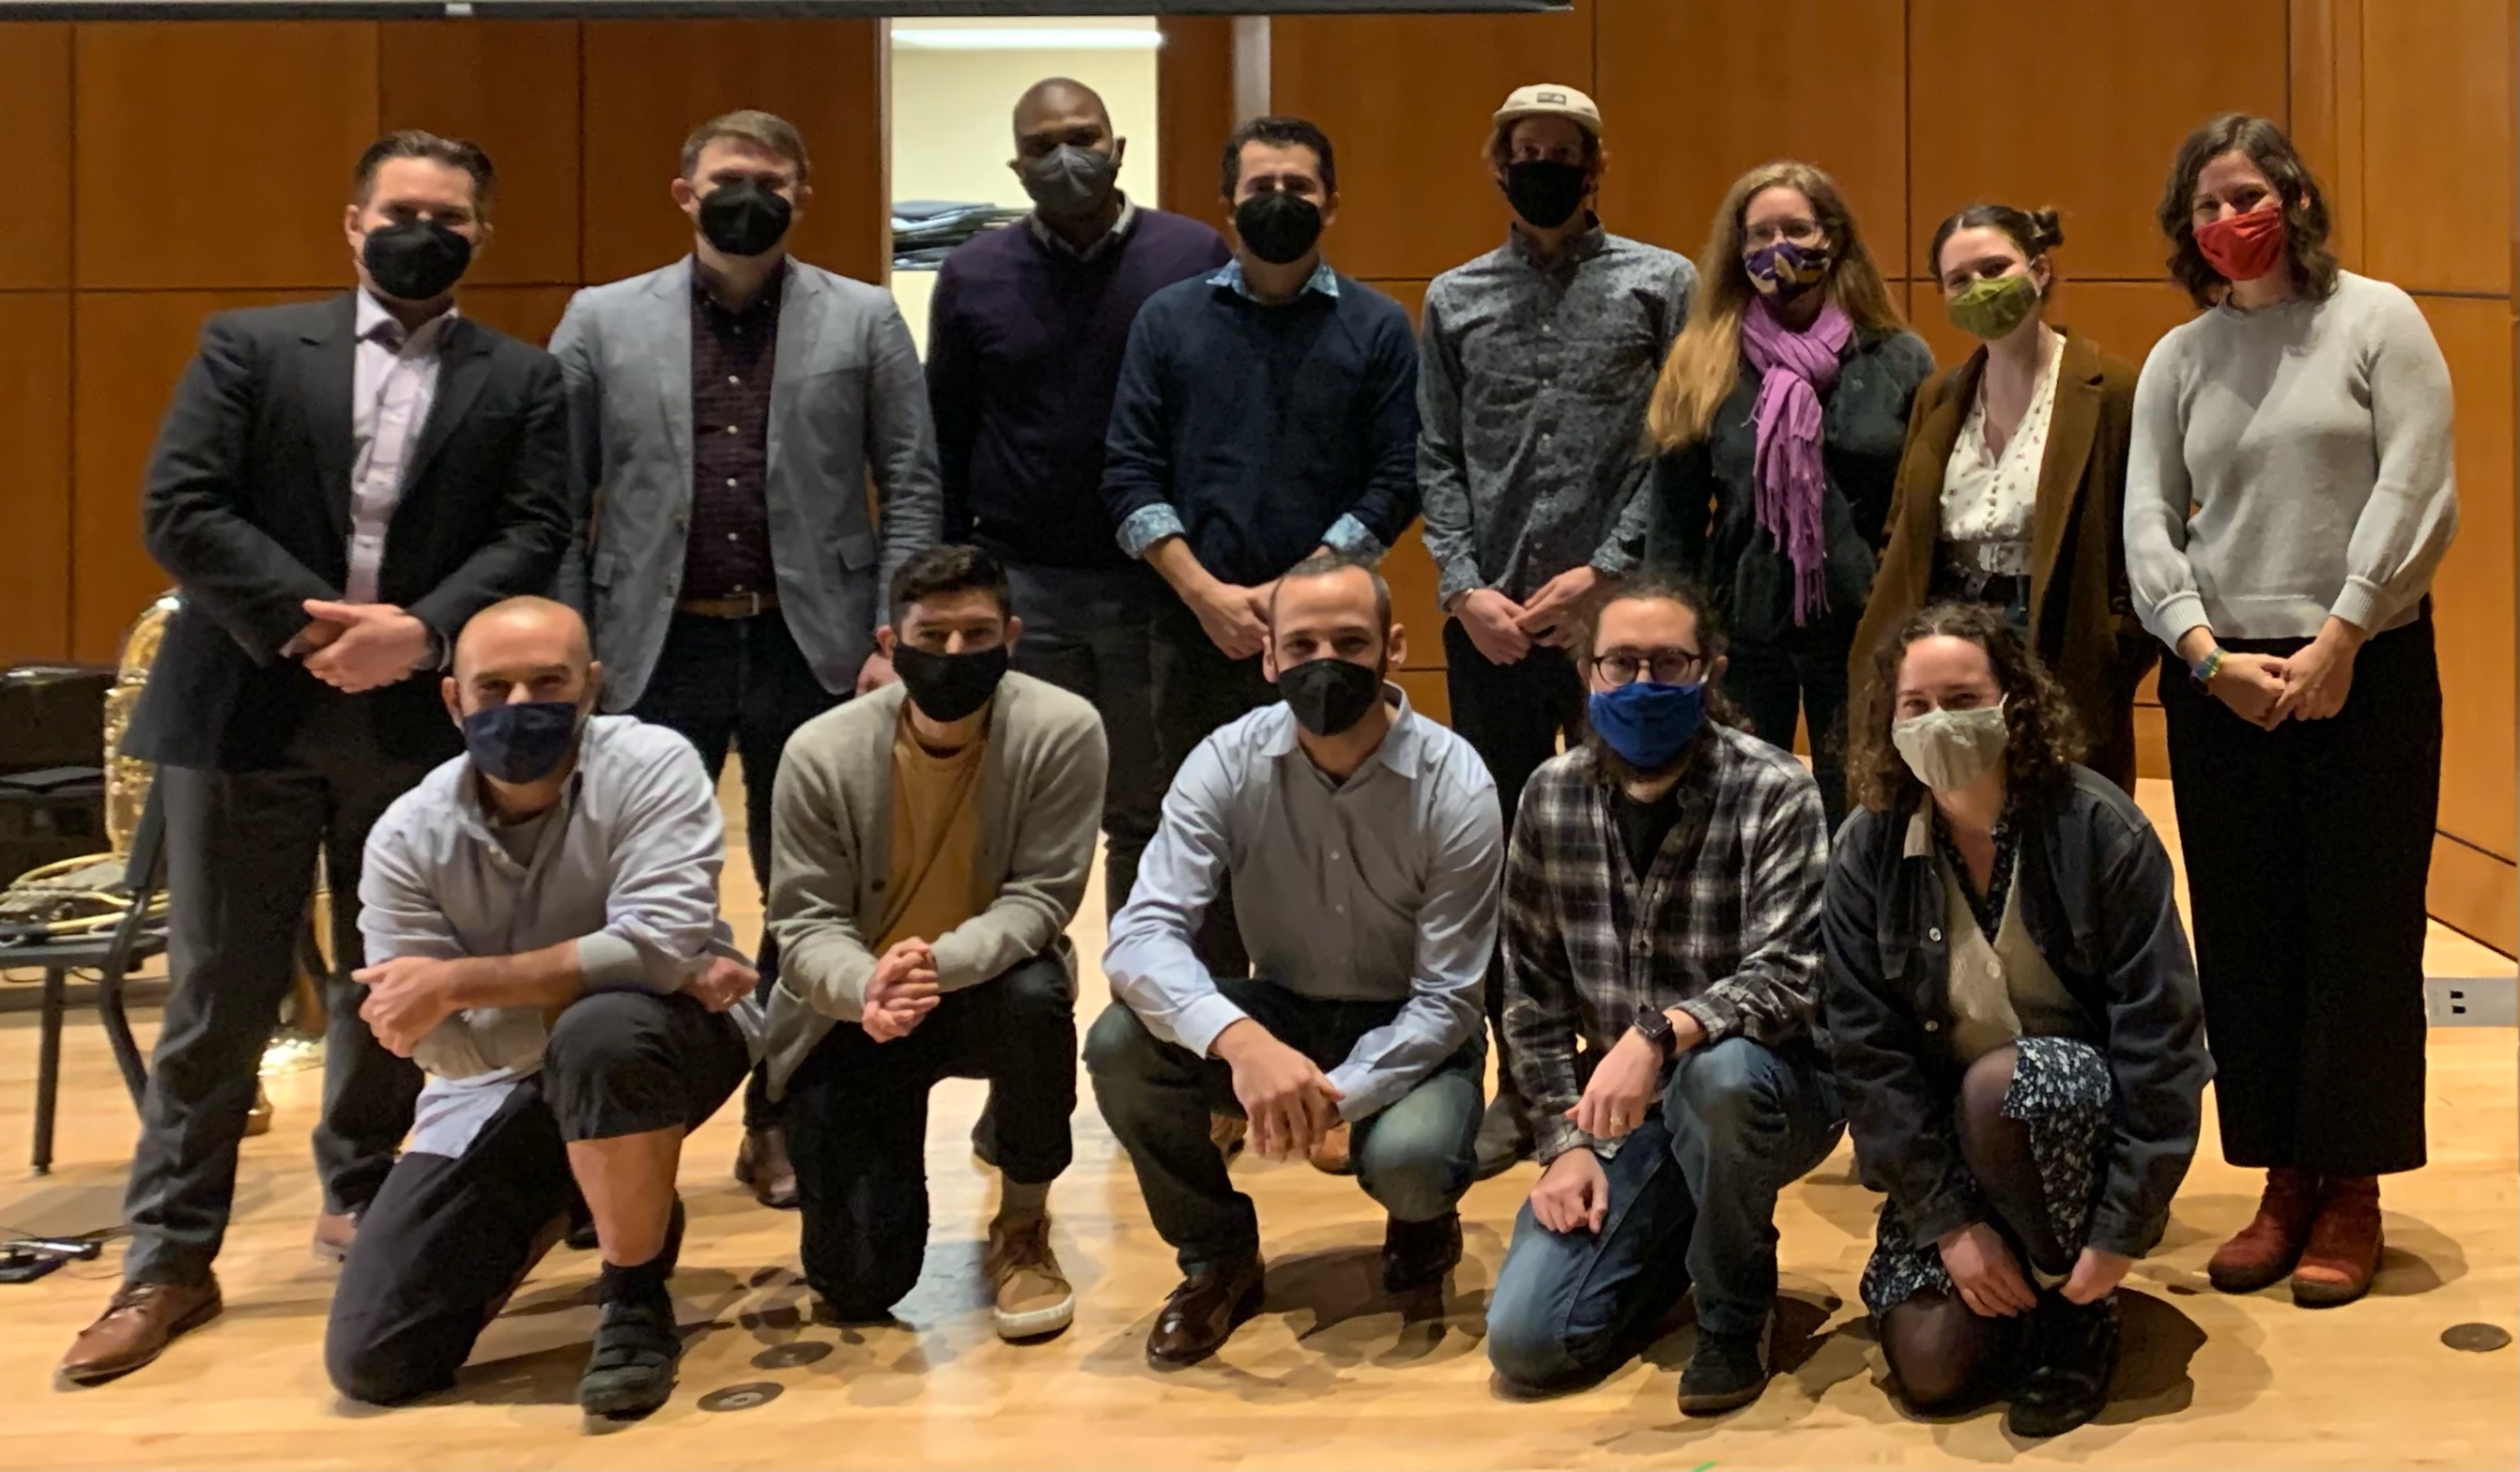
Scientists and musicians first meet at a collaboration fair hosted by Axiom Brass in October
Working with the School of Music allowed some scientists consider their own research. Johan Gilchrist worked with composer Bahar Tahari on the piece “700°C The Valley of Ten Thousand Smokes”, a piece that blends the sounds of the brass quintet with field recordings to describe the eerie build up and onset of the devastating 1912 Alaskan eruption of Novarupta volcano. “I’ve learned that recording the sounds of the natural phenomena I study is incredibly valuable and worthwhile” Johan remarked, “in fact, recording everything I observe with all my senses could prove useful for communicating my research in the future.”
Composers, musicians, and scientists came together to share the final musical pieces at the Chan Center on April 19th. After the successful night of performances, the minds behind the collaboration - EOAS’s Kirsten Hodge and the School of Music’s Valerie Whitney - are looking forward to reprising the project next year.
To read more media coverage on the collaboration, check out the following links:
Glacier Media via North Shore News, Castanet, Vancouver is Awesome, New Westminster Record, Alaska Highway News, Tricity News, Pique NewsMagazine, Richmond News, Delta Optimist, Sechelt / Gibsons Coast Reporter, Dawson Creek Mirror, Burnaby Now