EOAS Volcanologists Study the Eruption of Hunga Tonga-Hunga Ha'apai Volcano that Rocked the World

The people of Tonga are recovering from an extremely violent and explosive eruption of the Hunga Tonga-Hunga Ha’apai volcano located 65 km to the North of Nuku’alofa, the capital of the Tongan islands. Hunga Tonga-Hunga Ha’apai volcano erupted at 04:20 Tonga Standard Time on January 14, 2022 and produced a 20 km high eruption column. Then at 17:00 TST on January 15, 2022 the volcano violently exploded with a bang so loud that it rocked the ears of people on the island of Fiji some 700 km away and was heard as far away as Alaska, roughly 10,000 km away. Satellite instruments were able to track the shock wave as it travelled through the atmosphere to the opposite side of Earth in less than a day and continued to circumnavigate the Earth thereafter. The eruption generated tsunamis that devastated the islands of Tonga and travelled around the world, including in the Atlantic ocean where some researchers think the shock wave travelling along the ocean surface generated the tsunamis, which would be the first time such a natural phenomenon was observed with modern instrumentation.
The eruption of Hunga Tonga-Hunga Ha-apai is of pressing interest to EOAS volcanologists Colin Rowell, Johan Gilchrist and Mark Jellinek, not only because of its global effects, but because of the surprisingly violent character of the eruption, and – critically – that it was captured by a suite of modern satellite instruments (Figure 1).
To understand the distinct nature of the eruption, it helps to understand what can happen when erupting magma (at temperatures of around 1000 °C) comes into contact with much colder surface waters. When this happens, the resulting thermal shock sometimes causes the magma to fracture violently, exposing more of the magma’s fresh, hot interior. This can result in a chain reaction, tearing the magma apart into tiny pieces, exposing fresh magma surface, and delivering an incredible amount of heat energy to the water in mere thousands of a second. With enough magma and water involved, the result is a steam explosion with a power rivaling nuclear bombs. This process is a likely cause of the powerful shockwaves that emanated from the eruption on January 15th. The power of the large blast that circled the globe has been estimated at 10 megatons of TNT equivalent, more than 500 times the bomb dropped on Hiroshima, with some estimates rising as high as 50 megatons or more. This event may well have been primed by the eruptions of the day before, which destroyed much of the existing island that was above sea level (Figure 2), deepening the vent to tens of meters or more under the waves and possibly allowing sea water to more readily access the plumbing system. More water does not necessarily mean a more explosive eruption, however: if the volcanic vent had opened at even greater depths, the overlying water pressure would have dampened the resulting steam explosion, limiting its power and by connection, the record-breaking heights reached by the eruption column.
This is where modern satellite imagery comes into play, unprecedented in its clarity and resolution. Johan is using the high-quality photos that span the entire eruption to calculate heights of eruption clouds and how they spread across the atmosphere, key pieces of information when it comes to trying to predict how a volcanic eruption will affect the climate. “When eruption columns rise above the troposphere, us volcanologists immediately try to analyze the data to determine the potential for a volcano-climate effect,” says Johan Gilchrist. The troposphere is the lower layer of the atmosphere where weather happens and airliners fly, and typically stops at around 16 kilometers above sea level in the tropical areas of the world. Eruption clouds that rise higher than the troposphere, into a layer called the stratosphere, can stay circulating up there for months or years. That’s where climate-altering sulfur compounds like sulfur dioxide (SO2) can have the biggest effects. “This eruption column not only breached the troposphere, it continued to rise through to the upper limits of the stratosphere near the mesosphere” exclaims Johan. “Mark didn’t believe me when I told him I had measured a 55 km altitude for the highest visible cloud, and shoot, I didn’t believe my analysis either until another independent researcher also reported the same number.”
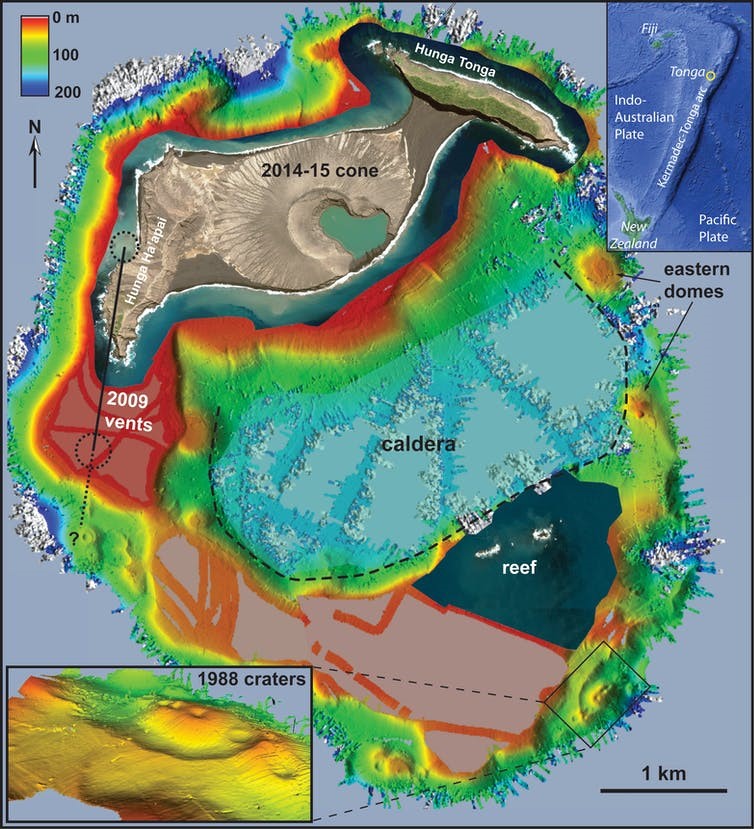
Figure 2: Bathymetry data showing the depth of the Hunga Tonga-Hunga Ha’apai caldera with a satellite image of the 2015-2022 location of its most recent eruptions. From Cronin (2022).
Despite its height, the eruption column has an unusually low amount of sulfur, which may be a characteristic of this type of steam-driven eruption according to a recent study of Colin’s, currently in peer-review. The study hypothesizes that water-rich eruptions should have weaker climate impacts than those driven by magma alone. “In my study, that’s a result of the added water changing both the heat available to the eruption as well as a change in the cloud chemistry, with higher amounts of water and fine particles being present in the cloud. Whether that’s exactly what is happening here, though, remains to be seen!”
Johan, Colin and Mark will continue to refine their analysis of the eruption in the coming weeks. Johan’s satellite-imagery analysis will provide parameters, such as column height and spreading rate, that Colin can input into new model simulations of the eruption. If the model is a test for how eruptions work in the real world, data from the real eruption acts as an answer key. If the model has the same outcomes as the real-world eruption, for example reproducing the observed eruption column top and umbrella cloud spreading heights, that gives researchers confidence to use the model as a tool to explore eruption processes in greater detail. Johan, Colin and Mark plan to use their model to gain more understanding of the properties of the eruption column as it rose through the atmosphere and, hopefully, come up with an estimate of the amount of ash and gases that were delivered to spreading clouds higher in the stratosphere. This estimate can be used, in turn, to run ash transport models that are used to set no-fly zones for airliners and in global climate models to assess potential impacts on Earth’s climate.
The research group’s future work aims to conduct analog experiments using materials like water and sand meant to mimic eruptions on a much smaller scale. These experiments allow the researchers to learn more about the physical processes that determine how erupted mass is transported in the eruption column, which ultimately determines where clouds spread in the atmosphere and how much ash and gas they carry. Insights from these experiments can be used to calibrate Colin’s computer models, to explore different climate impact scenarios between water-rich eruptions versus those driven by magma alone.
Being able to validate a model with real-world data is crucial, and is why eruptions like Hunga Tonga-Hunga Ha’apai are so critical to observe in great detail. The people of Tonga are suffering from this event, but the global community at large won’t have to deal with the potentially serious climate consequences that such an event can bring. It is essential that scientists learn about Hunga Tonga-Hunga Ha’apai’s eruption history, this latest eruption event and what types of eruptions could be in store for the future. That knowledge is used to help local communities, such as Tongans, prepare for and respond to these catastrophic events, and to help global society prepare for the climate-hardship that future volcanic events could cause.
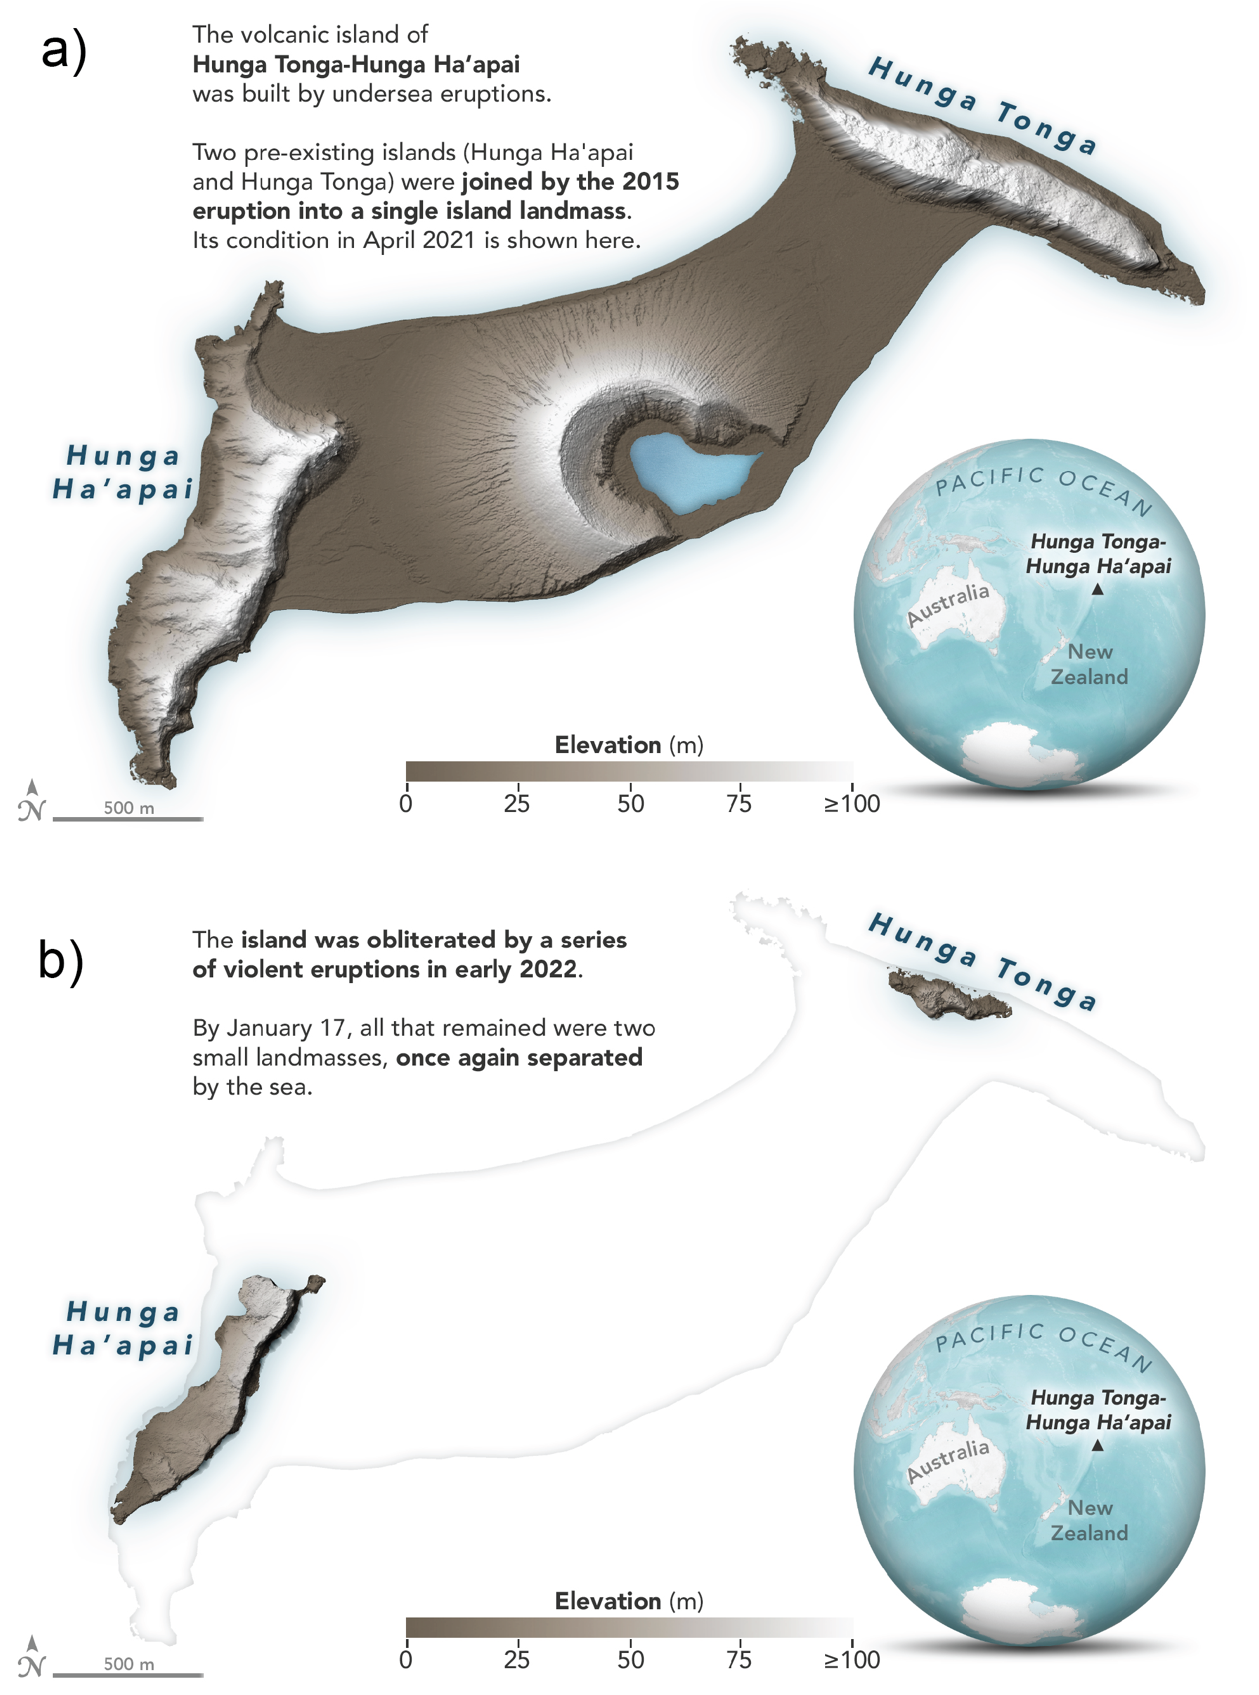
Figure 3: Digital elevation models of the Hunga Tonga islands before (a) and after (b) the Jan 14-15 eruptions. Courtesy of NASA.