New interactive teaching and learning resources to explore climate and Earth science concepts

How can students be inspired and motivated to interactively explore complex concepts? The introduction of lightweight, focused, interactive learning apps or dashboards is part of the larger TLEF funded OCESE (Opensource Computing for Earth Science Education) project in EOAS.
Online simulations and datasets are not new, so what’s special about our dashboard learning apps? The answer is that they are designed to enable immediate exploration of a tightly focused concept and/or dataset. Some bring to life complex ideas, such as modeling the factors affecting global temperature, while others enable students to address meaningful problems by exploring and interpreting carefully curated existing data sets. Built largely by students and coded in Python, such dashboards can:
- Fill the gap between older paper-based resources and current feature-rich, or experts-only datasets and software tools;
- Enable un-guided or guided exploratory engagement with concepts or data;
- Complement a course’s rigorous treatment of a subject by enabling students to gain intuition through exploration of suitable simulations and datasets;
- Allow students at any level to focus on the problem or concept without the distraction of complicated new tools or larger-than-necessary data sets.
![]() Over ten dashboards have been completed or are in progress. All are described briefly at our project website’s dashboard page. They are licensed for open use, and all will become formal, searchable UBC Open Education Resources (OERs). Find details on our one page project outline, or the emerging project website. Below are some snapshots of the dashboards and you can click on the link in the title or the snapshot to interact.
Over ten dashboards have been completed or are in progress. All are described briefly at our project website’s dashboard page. They are licensed for open use, and all will become formal, searchable UBC Open Education Resources (OERs). Find details on our one page project outline, or the emerging project website. Below are some snapshots of the dashboards and you can click on the link in the title or the snapshot to interact.
Two examples of process models or simulations for exploring concepts
1. Factors affecting global temperature: Contributions of several natural and anthropogenic factors to the global temperature anomaly are plotted for 1880-2005.
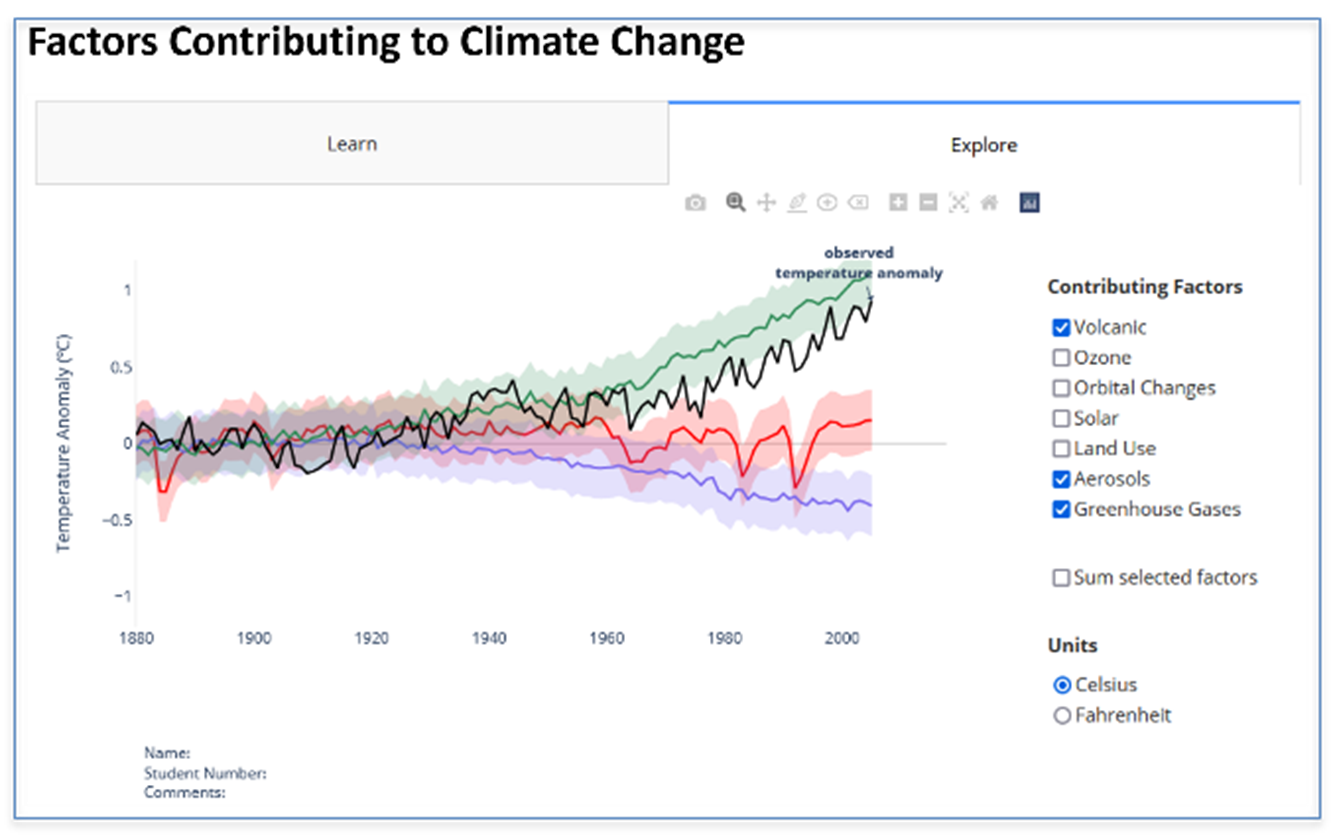
Piloted in EOSC 112, 116, 326, 340, 425. Links at “Global temperature” on our dashboards page.
2. Unconfined-flow: Interactive model of linear (“1D”) groundwater flow in an unconfined acquifer between two sources, with surface recharge included.
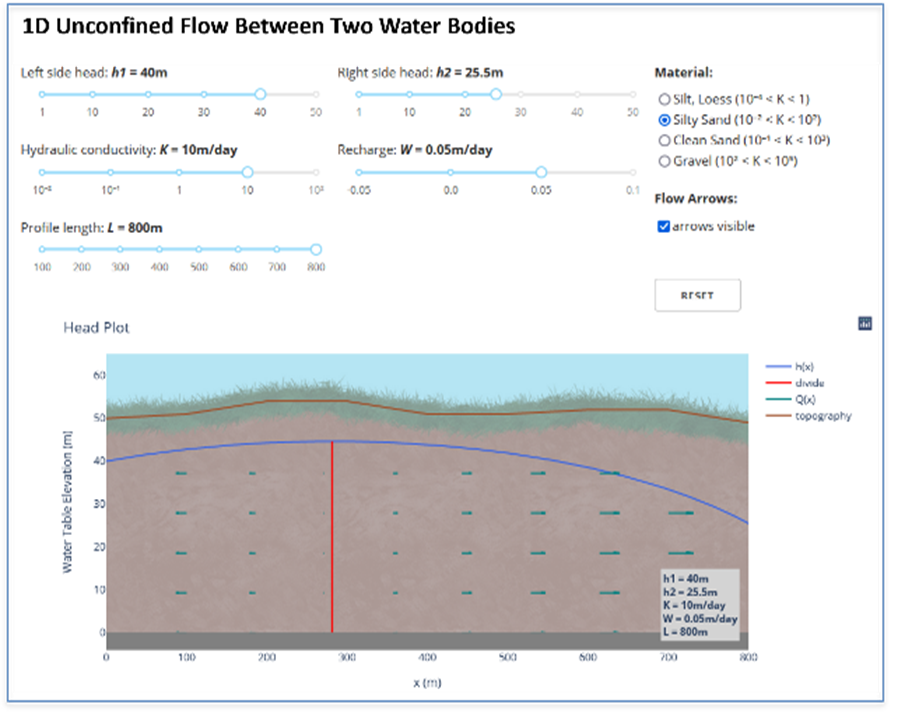
Piloted in EOSC 325. Links at “Unconfined-flow” on our dashboards page.
Two examples for exploring limited but real data sets
1. Oceanography dataviewer: observe and compare trace element and physical properties in the water column at selected locations in the Southern Ocean, the Atlantic and the North Pacific.
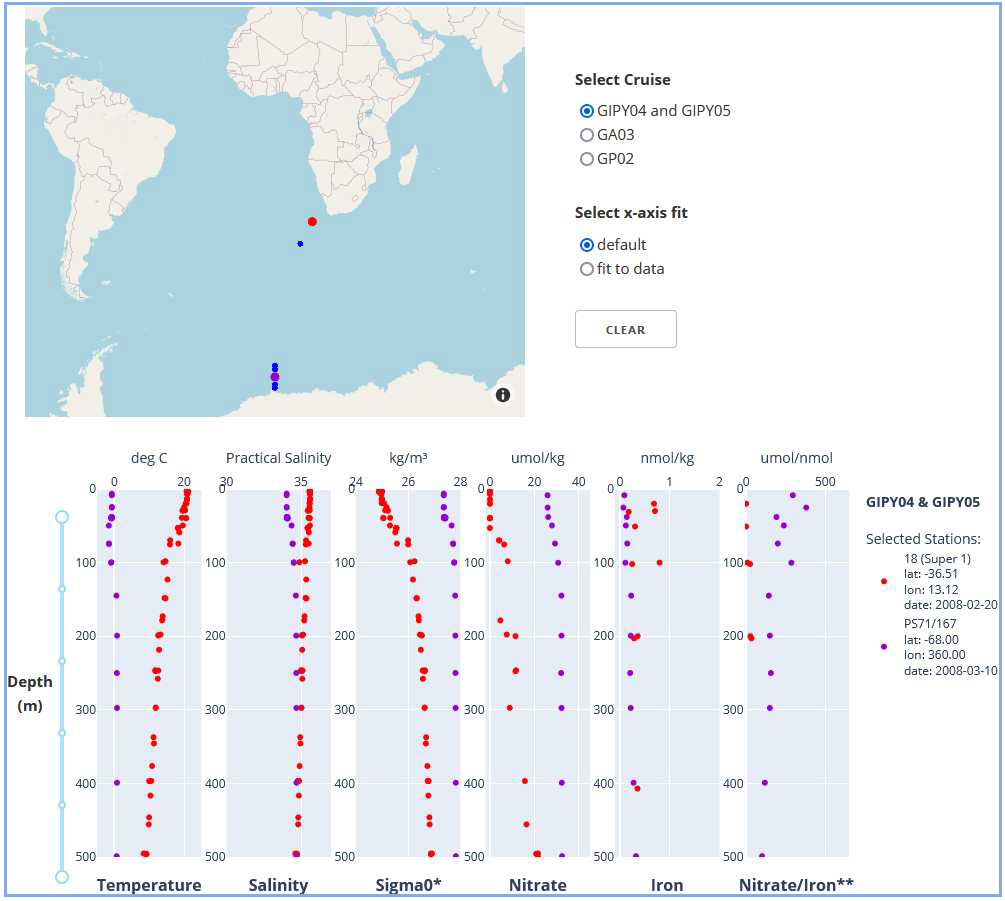
Piloted in EOSC 372. Links at “ocgy-dataviewer” on our dashboards page.
2. CO2 concentrations at Mauna Loa (Hawaii) and the South pole since 1958, including simple linear modeling.
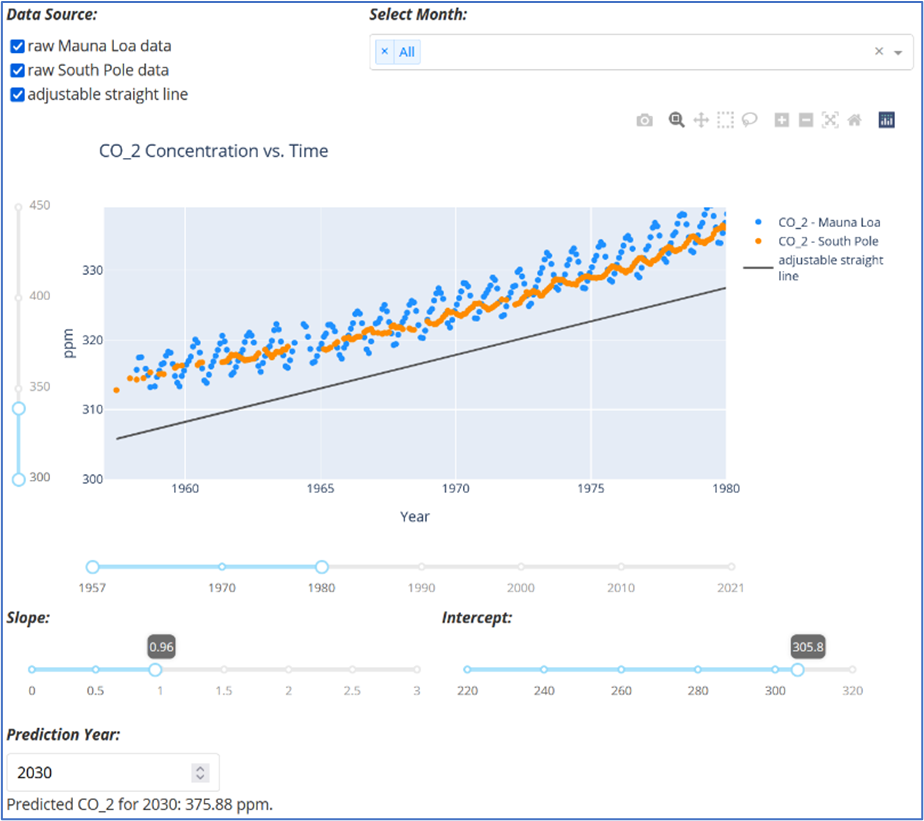
Piloted in ENVR 300. Links at “Atmospheric CO2” on our dashboards page.
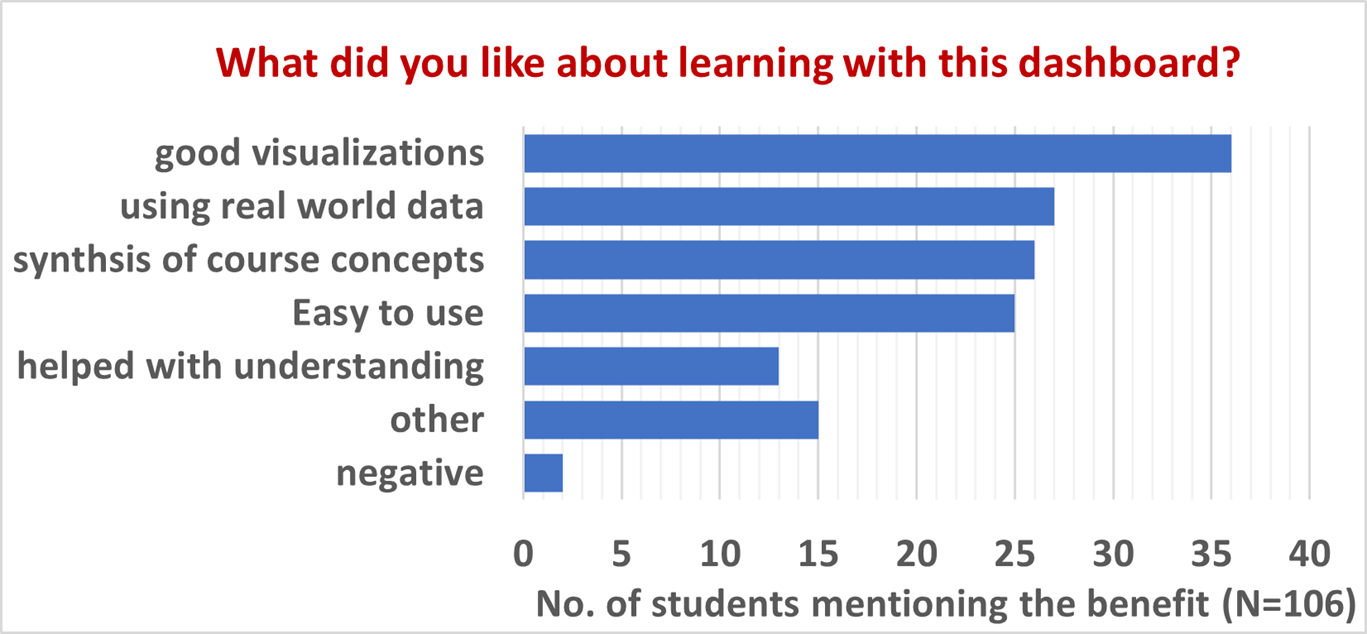
Reactions from students and instructors
Student’s reactions via survey questions added to an oceanography course assignment (132 students):
Examples of comments from students:
"I liked how the dashboard exercise applied various concepts using real data from the world's oceans."
"The online dashboard was quite easy to use and interesting as it allowed us to compare different nutrients/properties profiles in different oceans, synthesizing all the concepts in the course."
Instructor’s feedback (during design/build discussions):
"I am so impressed ... I love how (a) sliders constrain and adjust axes, (b) data at various real stations can be chosen on a map and compared, (c) results can be saved to submit for assessment. … thank you to the team!
Work in progress
We are actively searching for new ideas! Please contact one of our principles with ideas or questions (Tara Ivanochko, Phil Austin, Francis Jones, Lindsey Heagy). We'd love to discuss new dashboard ideas, ways of including new or existing dashboards into your lessons & assignments, or creative ways to have dashboards inspire your students and help them learn.
- As of March 2022, the OCESE project has 1 more year of funding. Existing dashboards will be fine-tuned based on experiences in use.
- Costs – i.e. time to develop: It may take anything from a few days (preferred) to extensive effort spanning several terms, depending on the complexity of the app. But an iterative design cycle is important, even with the simplest.
- The design cycle involves concept-design, prototype code, test, develop the learning task (in-class worksheet, take-home assignment, etc.), iterate, implement, gather feedback, improve.
- Theoretical framework: Essentially, “guided inquiry” is a good starting point. There is a fairly extensive literature on use of simulations in learning at all levels – especially from the PhET organization at U. Colorado, Boulder. See references on our project website. The main characteristic of most EOAS dashboards is that the code is kept relatively simple, and scope is tightly focused rather than trying to do too much.
- In EOAS, several third party dashboards are also in use, such as in EOSC 112 (IPCC climate atlas) and EOSC 340 (greenhouse PhET). See our list for some selected examples. Contact OCESE project principles for help with finding and implementing these types of 3rd party interactive learning resources.
- OCESE project documentation (in progress) includes the growing list of apps, and pages with dashboard development guidelines, ways of deploying dashboards locally or online, and some guidelines for teaching with dashboards.
Dashboard development credits
- EOAS student contributors: A. Loeppky, J. Byer, F. Rossmann, Y. Egorovo, Y. Kuzmenko.
- EOAS faculty contributors: Austin, Ivanochko, Jones, Heagy, Maldonado, Orians, Waterman, Sutherland, Orsi, Radic, Hodge, Ameli, Hickey.
- See also our complete list of all student and faculty contributors.
To learn more, and especially if you have an idea for an app that will inspire students and help them learn in EOAS courses, please contact any of the team members listed on the contributors page.
For more EOAS news items, please use the "search" and "filter" options at the top of our news and events page.